Organizations love PDFs, especially governmental bodies. To the masses, they are easy to read, with nice and clean formatting that is easy on the eyes. To the data scientist, they can be nightmares to upload. For example, take a look at this PDF:
Source: PennsylvaniaDepartment of Health, Demographics of Nursing Home Residents.
What a 105-page nightmare that would be! R reads PDFs as 1-line imports, but clearly this PDF is not designed with data scientists in mind.
Extracting this data for analysis and manipulation is going to be a maze of extractions, re-arrangements, and ultimately many extra-curricular relaxation techniques.
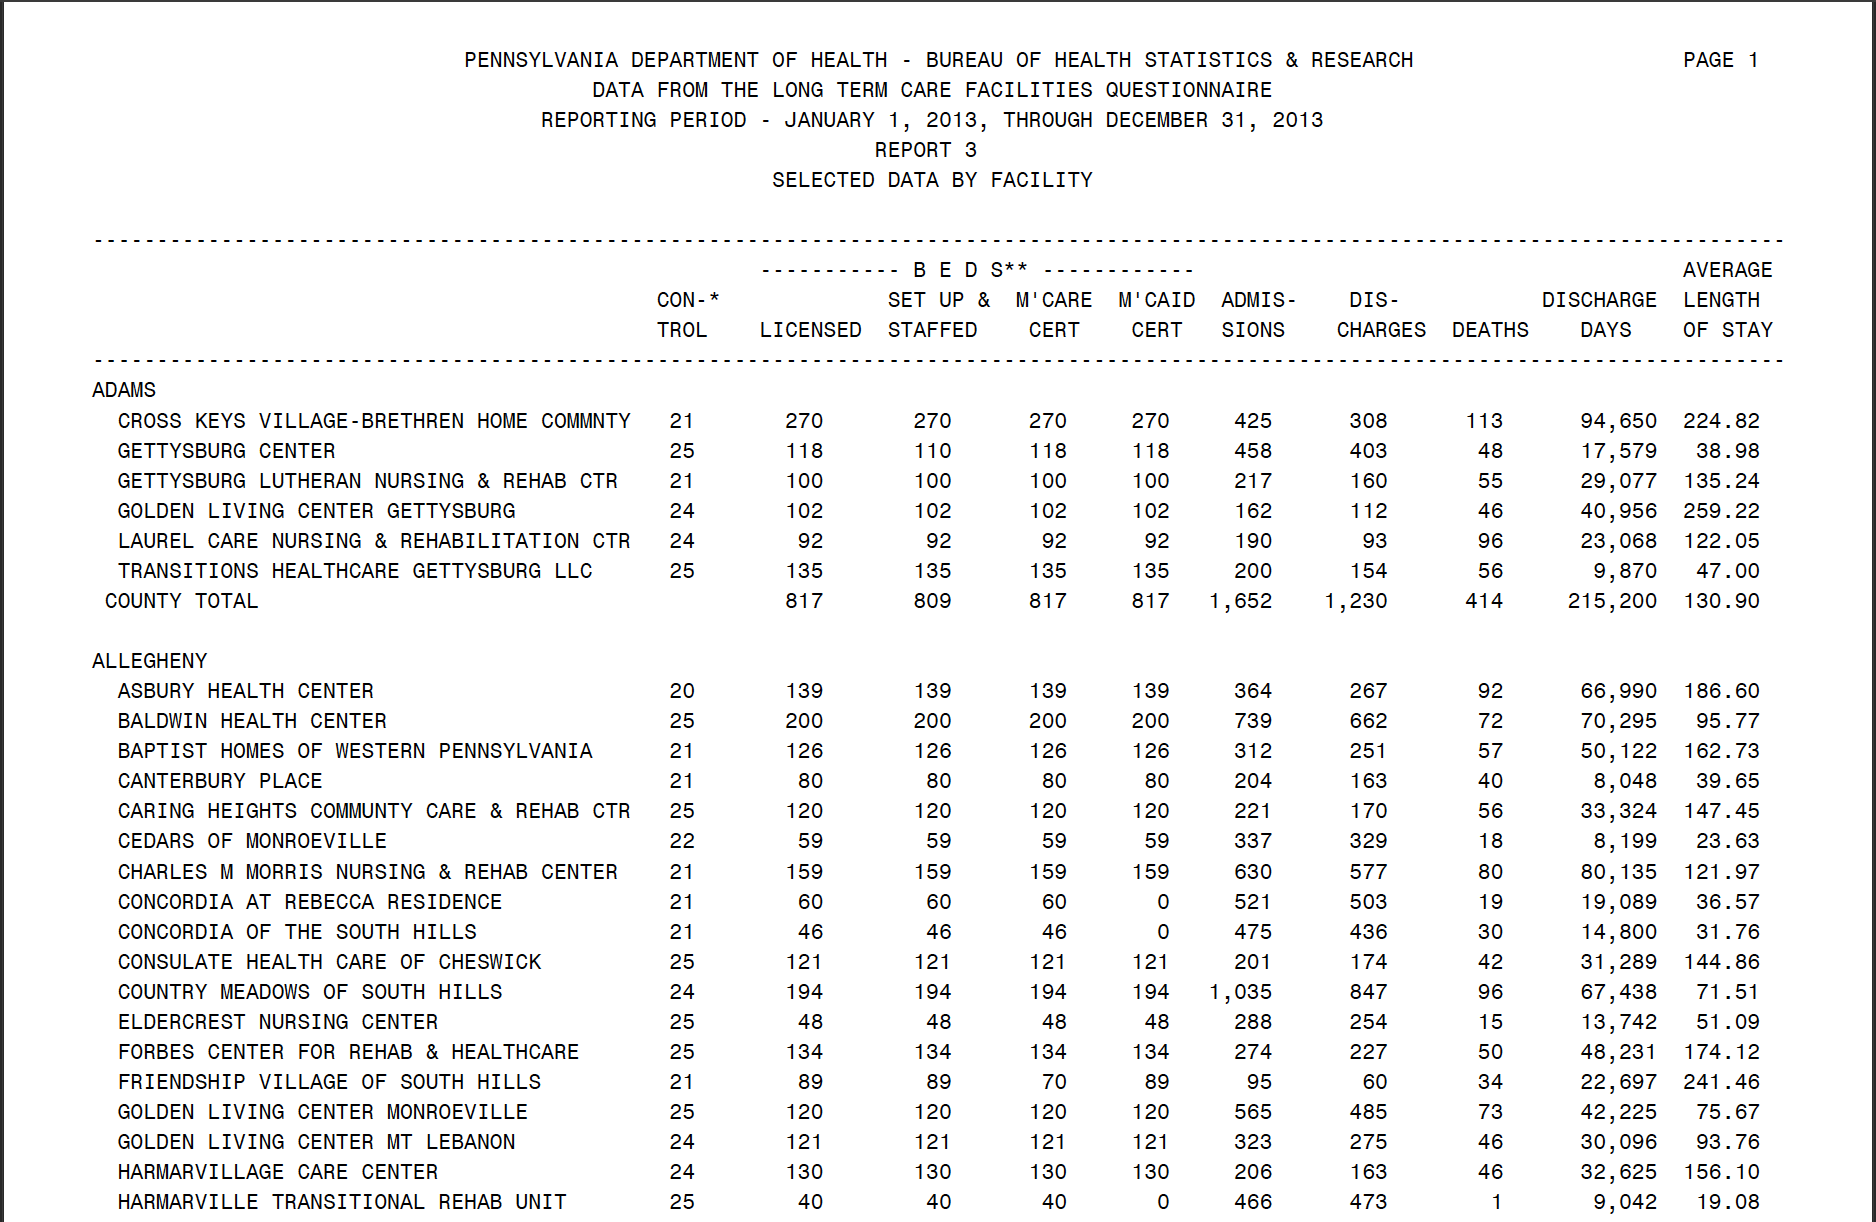
The good news is, I like doing this! So here I’m going to try to walk you through both an example and through my thoughts to help you with your own adventures. This technique will utilize R and several R packages, namely the Tidyverse package and Pdftools packages. For this example we are going to use a slightly easier PDF to practice on. This PDF contains 17 pages, with the top on every page looking like so (top), and the bottom looking like so (bottom).
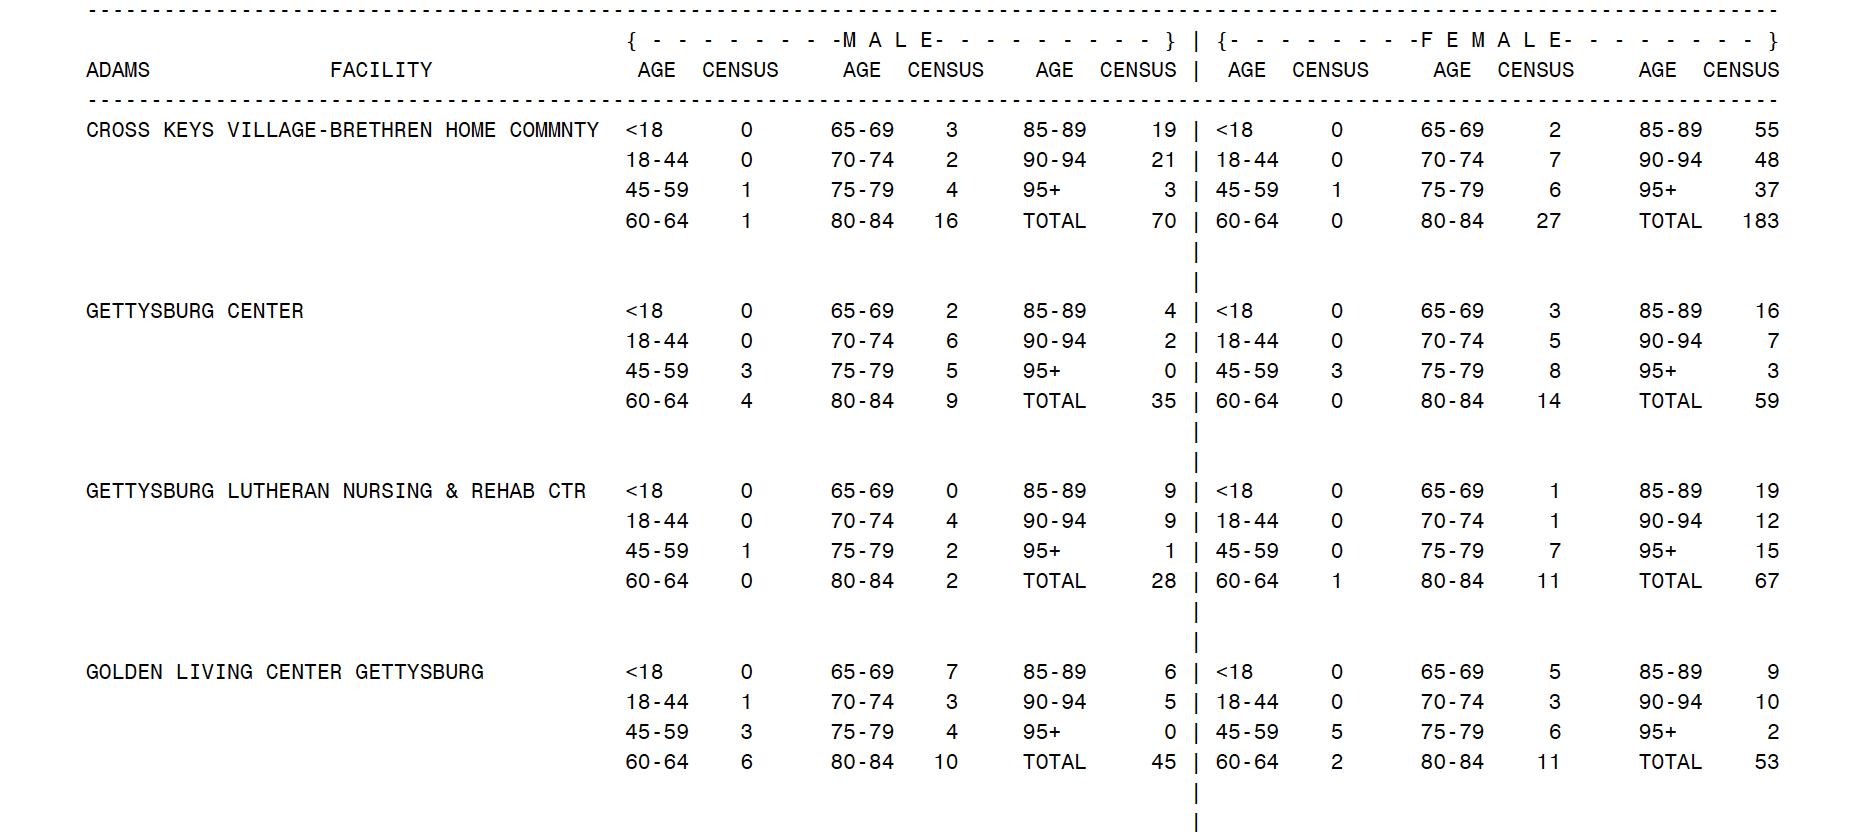
Source: Pennsylvania Department of Health. Top of PDF.

#dataframes #pdf #data-science #data #r
