Survival analysis is used for modeling and analyzing survival rate (likely to survive) and hazard rate (likely to die).
Let’s start with an example:
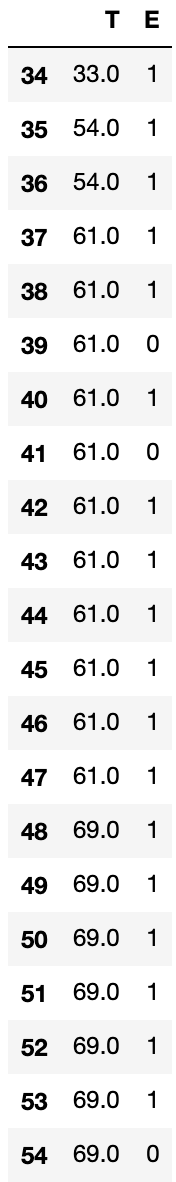
Here we load a dataset from the lifelines package. I am only looking at 21 observations in my example. The survival analysis dataset contains two columns: T representing durations, and E representing censoring, whether the death has observed or not. Censoring is what makes survival analysis special. There are events you haven’t observed yet but you can’t drop them from your dataset.
For example, in our dataset, for the first individual (index 34), he/she has survived until time 33, and the death was observed. But for the individual in index 39, he/she has survived at 61, but the death was not observed.
from lifelines.datasets import load_waltons
df = load_waltons()
df1 = df.iloc[34:55][['T','E']]
df1
Kaplan-Meiser Estimate
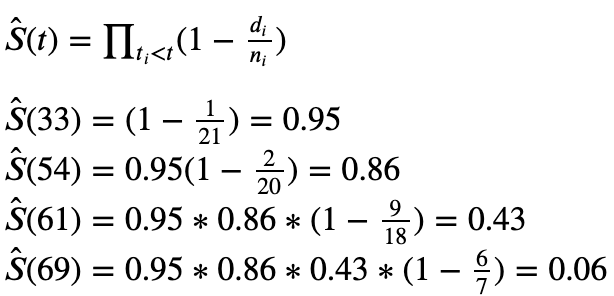
The easiest way to estimate the survival function is through the Kaplan-Meiser Estimator. Equation is shown below .It’s basically counting how many people has died/survived at each time point. d_i represents number of deaths events at time t_i, n_i represents number of people at risk of death at time t_i.
Again, use our example of 21 data points, at time 33, one person our of 21 people died. Thus, the survival rate at time 33 is calculated as 1–1/21. At time 54, among the remaining 20 people 2 has died. At time 61, among the remaining 18, 9 has dies. At time 67, we only have 7 people remained and 6 has died. We can see that Kaplan-Meiser Estimator is very easy to understand and easy to compute even by hand.
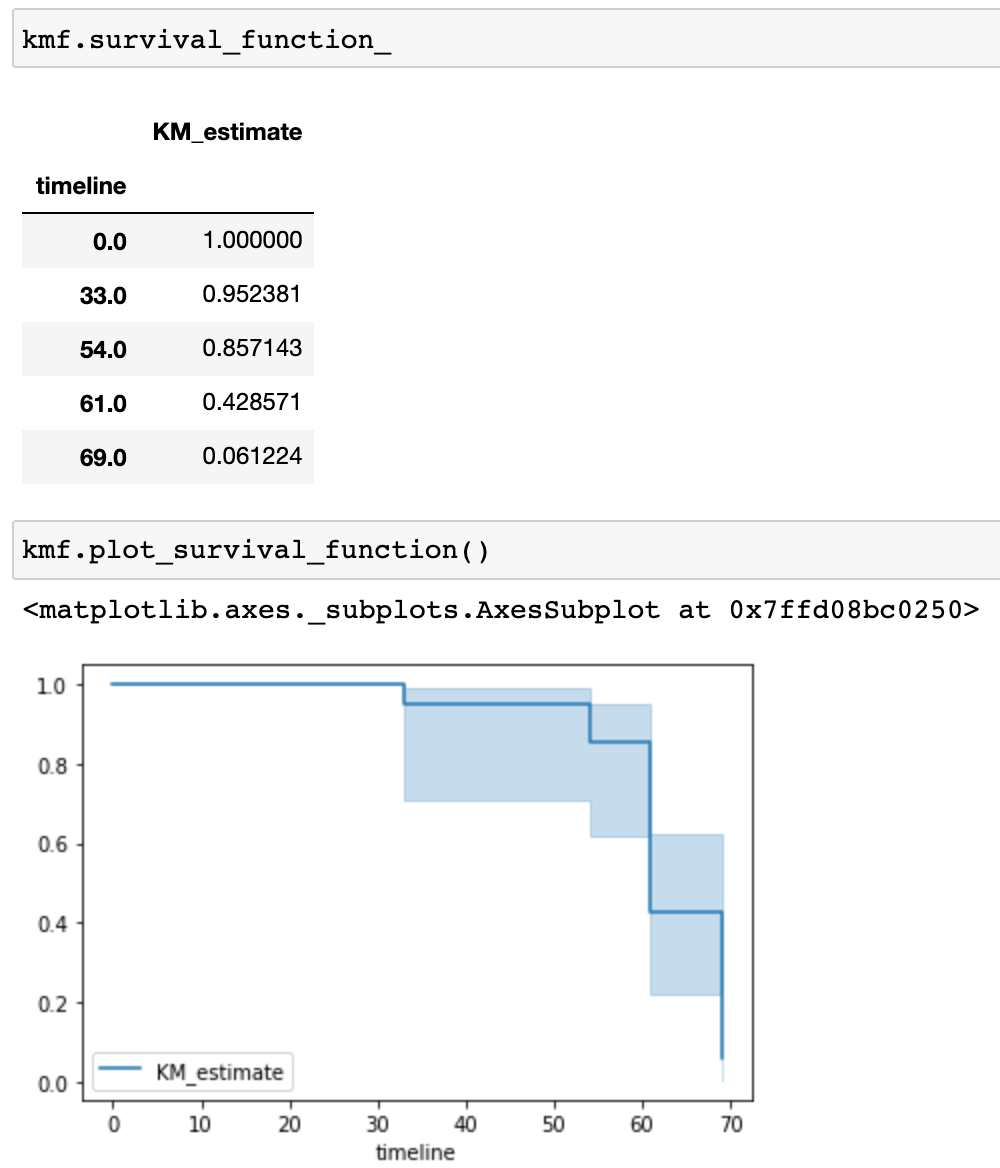
Here we get the same results if we use the KaplanMeierFitter in lifeline. In addition to the functions below, we can get the event table from kmf.event_table , median survival time (time when 50% of the population has died) from kmf.median_survival_times , and confidence interval of the survival estimates from kmf.confidence_interval_ .
T = df1['T']
E = df1['E']
from lifelines import KaplanMeierFitter
kmf = KaplanMeierFitter()
kmf.survival_function_
kmf.plot_survival_function()
#statistics #data-science #python #survival-analysis #programming