Hello dear readers,
Today’s article is about some experiments I’ve been doing with Tekton CI/CD + Prometheus.
Continuous Integration and Deployment is becoming more and more a hot topic — everyone wants a 100% automated, flawless, fast, code integration, and deployments.
But how can a team or a company achieve that?
Usually is a step-by-step process and not a ready-to-install solution (if there’s one though, please tell me !! ;) ).
For that reason, metrics will help you to keep track of your CI/CD improvements and to understand what needs to be adjusted.
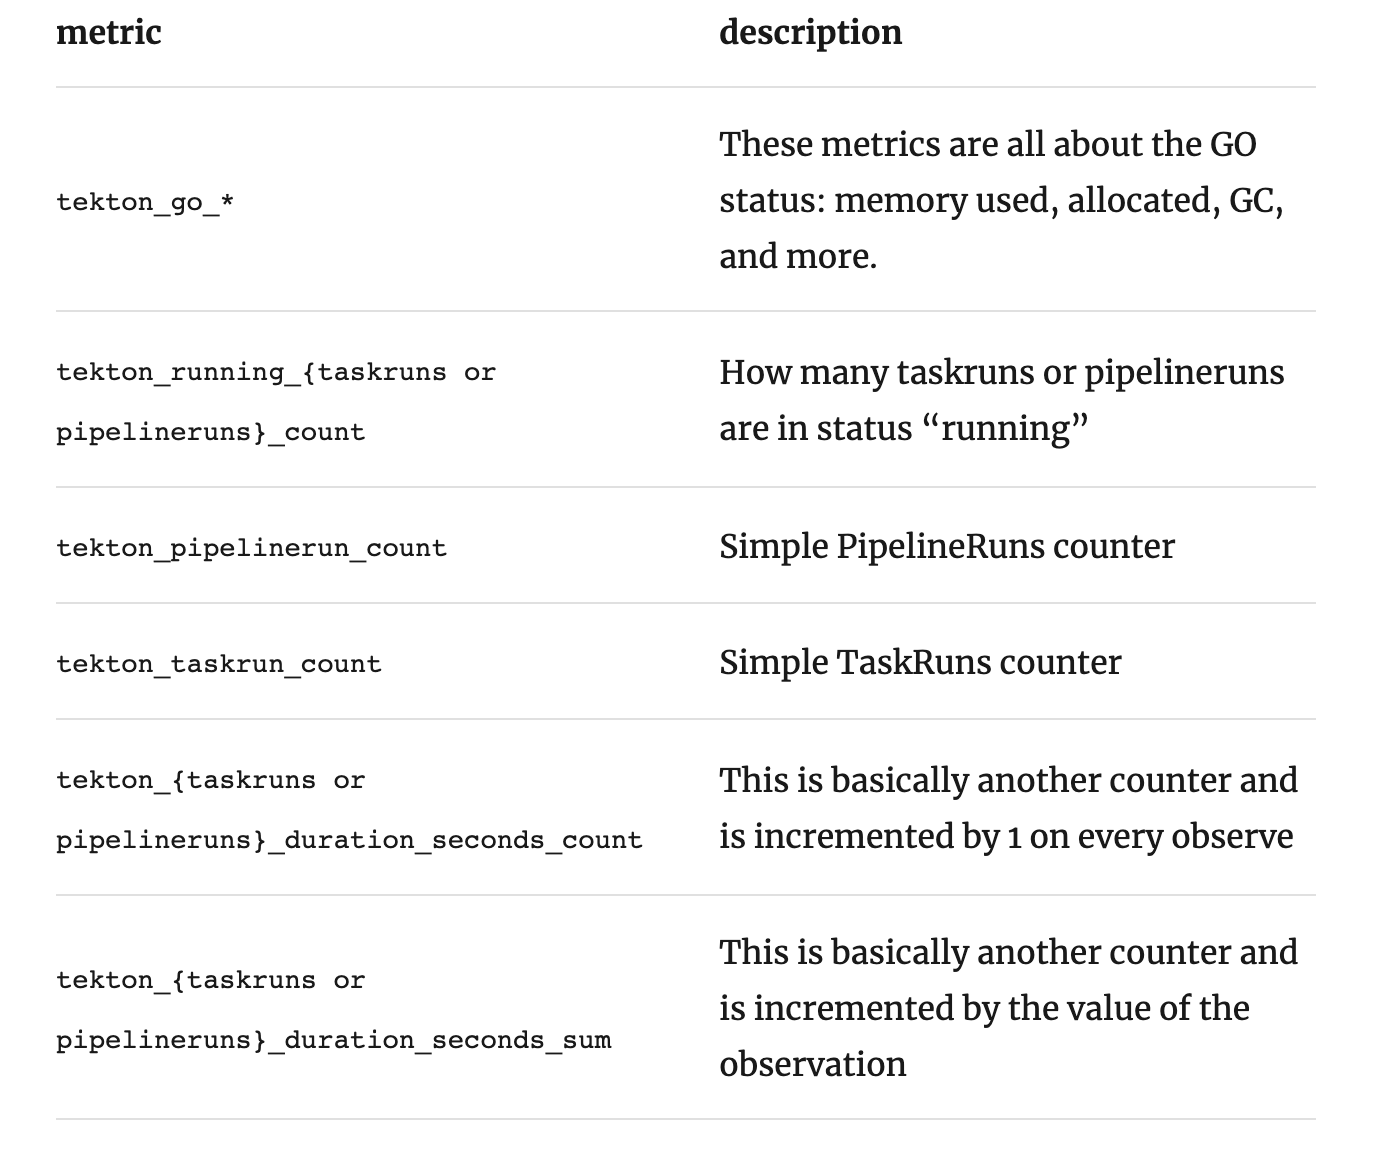
Luckily, if you are using Tekton, there are some very useful metrics by default.
Honestly, I couldn’t find enough documentation on the metrics exposed by Tekton. However, after a few experiments, I came up with a list of what (in my opinion) are the most valuable metrics.
The demo I’ve prepared uses Prometheus as a backend to collect and display metrics, but note that others backends (such as StackDriver/Cloud Monitoring) are supported too.
Tekton CI/CD: Useful Indicators
#kubernetes #prometheus #ci-cd-pipeline #observability #tekton