ganttrify
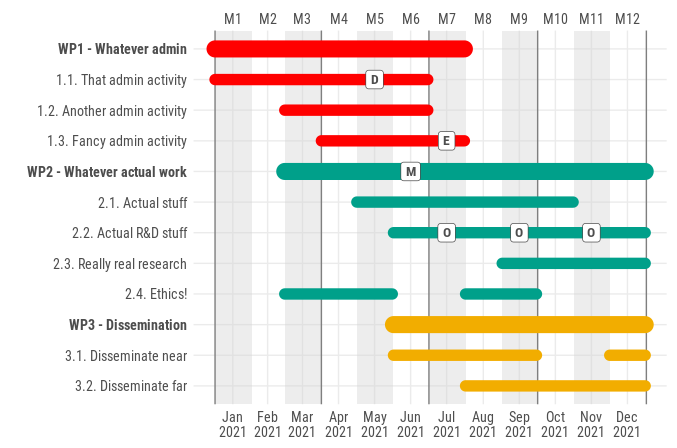
ganttrify facilitates the creation of nice-looking Gantt charts, commonly used in project proposals and project management.
Motivation
It is possible to find online documented attempts at facilitating the
creation of Gantt charts from R. Some of them
(e.g. this
and this)
use ‘ggplot2’, but I feel they do not look very nice. The same goes for
the answers I found in the relevant Stackoverflow
Even
enables the creation of Gantt charts in R, but again, I don’t like the
end result.
I did find a solution that was rather visually
but it was in base R, and all the cool kids nowadays know that base
plotting in R exists only for compatibility with
S: not an option! (Hey, I’m joking,
don’t @ me!)
Given what is evidently my posh taste for Gantt charts, I had no other
option than making this package with a pretentious, gentrified name,
instead of the obvious “ganttr”.
Please welcome ganttrify.
#data visualization #data-science