ROC and AUC curves with simple example are explained at this video which dedicated to all data scientists, and to all Machine Learning specialists.
Explanation is divided into following parts:
- How do we use prediction threshold (cut-off line).
- How do we plot data on Logistic Regression (Sigmoid) curve
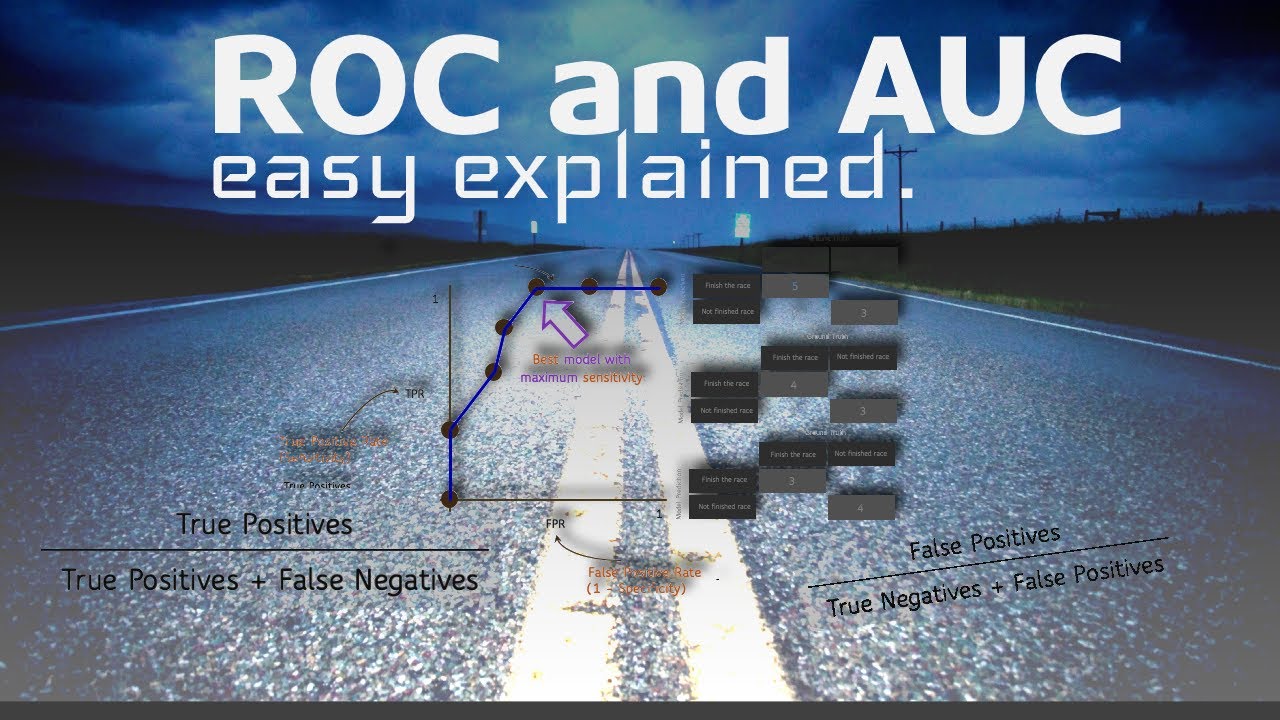
- How do we understand Confusion Matrixes (True Positives, True Negatives, False Negatives, and False Positives), Supervised Learning approach.
- How we calculate TPR (True Positive Rate) and how do we use it in plotting ROC.
- How we calculate FPR (False Positive Rate) and how do we use it in plotting ROC (Receiver operating characteristic).
- How we draw AUC (Area Under the Curve) based on ROC curves.
- How we can compare different Machine Learning Binary Classification models and algorithms with AUC.
For get benefit of this video you do not need to know Python or R. Just be careful about main definition of statistics, calculus and go ahead.
I hoped to create one of the best explainable video on Youtube about ROC and AUC. Comment bellow and drop your opinion!
#roccurve
#auccurve
#machinelearningtutorial
#roccurve #auccurve #machinelearningtutorial
1.20 GEEK