With so many types of data distributions to consider in data science, how do you choose the right one to model your data? This guide will overview the most important distributions you should be familiar with in your work.
By Madalina Ciortan, Data scientist, PhD researcher in bioinformatics at ULB.
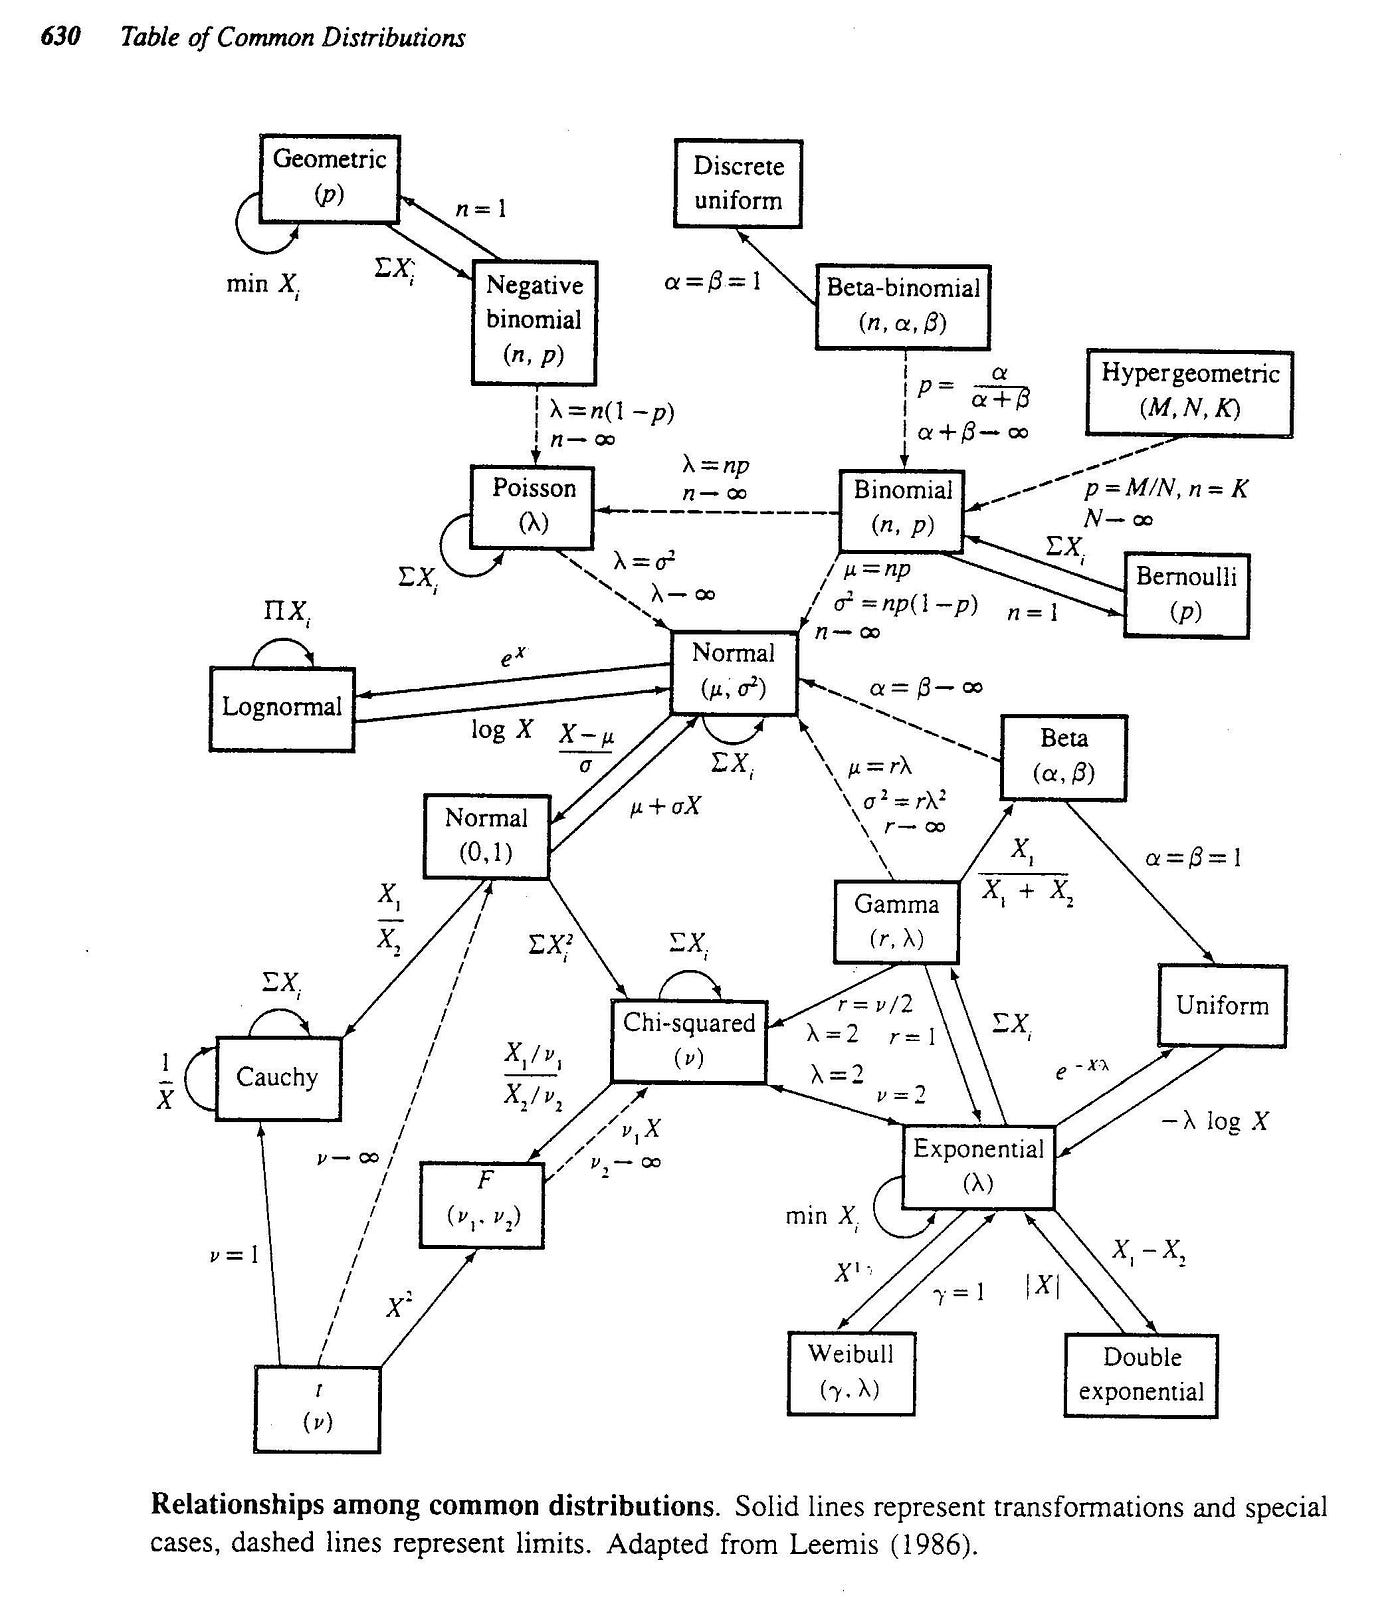
There are over 20 different types of data distributions (applied to the continuous or the discrete space) commonly used in data science to model various types of phenomena. They also have many interconnections, which allow us to group them in a family of distributions. A great blog post proposes the following visualization, where the continuous lines represent an exact relationship (special case, transformation or sum), and the dashed line indicates a limit relationship. The same post provides a detailed explanation of these relationships, and this paper provides a thorough analysis of the interactions between distributions.
The following section provides information about each type of distribution depicting what phenomena it typically models, some example scenarios illustrating when it makes sense to choose the distribution, the probability distribution/mass function, and its typical shape in a visualization.
The probability density function is a** continuous approximation** in terms of integrals of the density of a distribution or a smooth version of histograms. Cumulative distribution function can be expressed as F(x)= P(X ≤x), indicating the probability of X taking on a less than or equal value to x. PMF functions apply to the discrete domain and give the probability that a discrete random variable is exactly equal to some value.
#big data