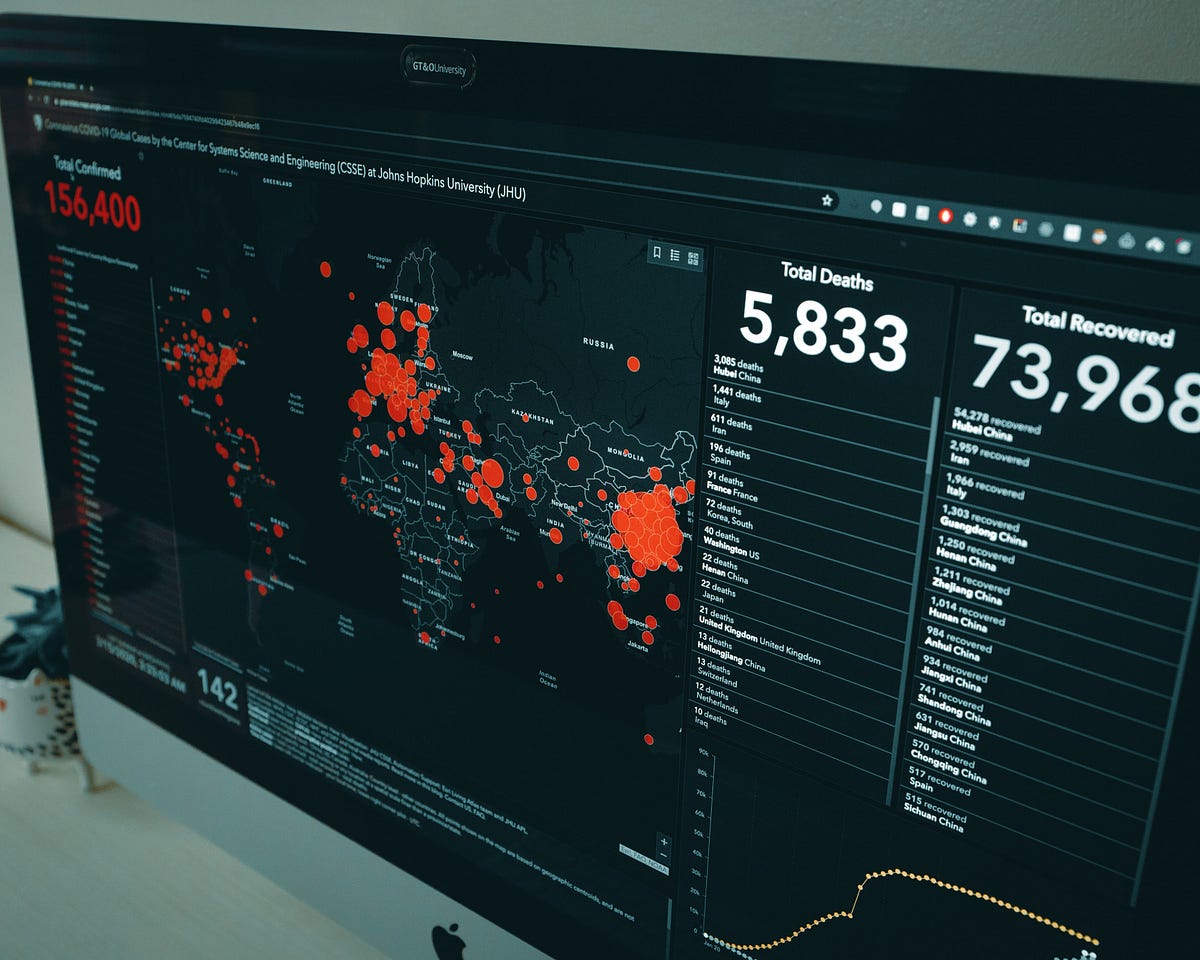
In the rapidly growing world of today, when technology is expanding at a rate like never before, big data is swiftly walking into people’s lives. Though people may have ways to obtain data, when it comes to drawing insights or conclusions with it, there exists a scratching on the head because the data were too many.
As they said a picture is better than a thousand words, executives and non-tech decision-makers heavily rely on and prefer visualizations and infographics to understand the underlying business insights and convey/pitch to the stakeholder. Data-driven decision making is making its way to the top and we need to make sure to stay upbeat with the tools for the art.
Having said that, this week I have compiled the top libraries that I have used, discovered, or heard about for great data visualizations and a bonus! Let’s get right into knowing these libraries, in no particular order.
#towards-data-science #data-science #r
