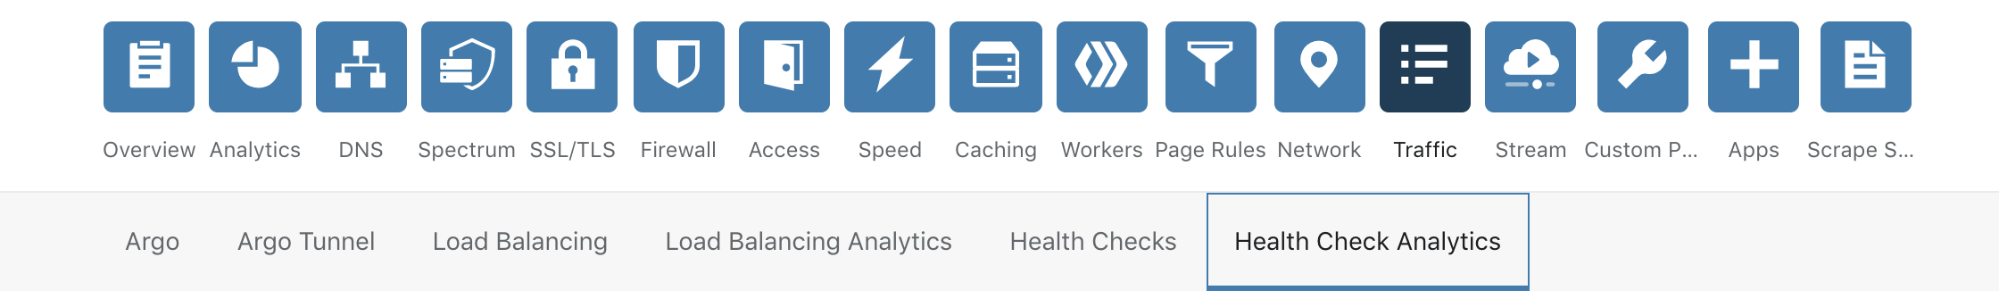
At the end of last year, we introduced Standalone Health Checks - a service that lets you monitor the health of your origin servers and avoid the need to purchase additional third party services. The more that can be controlled from Cloudflare decreases maintenance cost, vendor management, and infrastructure complexity. This is important as it ensures you are able to scale your infrastructure seamlessly as your company grows. Today, we are introducing Standalone Health Check Analytics to help decrease your time to resolution for any potential issues. You can find Health Check Analytics in the sub-menu under the Traffic tab in your Cloudflare Dashboard.
As a refresher, Standalone Health Checks is a service that monitors an IP address or hostname for your origin servers or application and notifies you in near real-time if there happens to be a problem. These Health Checks support fine-tuned configurations based on expected codes, interval, protocols, timeout and more. These configurations enable you to properly target your checks based on the unique setup of your infrastructure. An example of a Health Check can be seen below which is monitoring an origin server in a staging environment with a notification set via email.
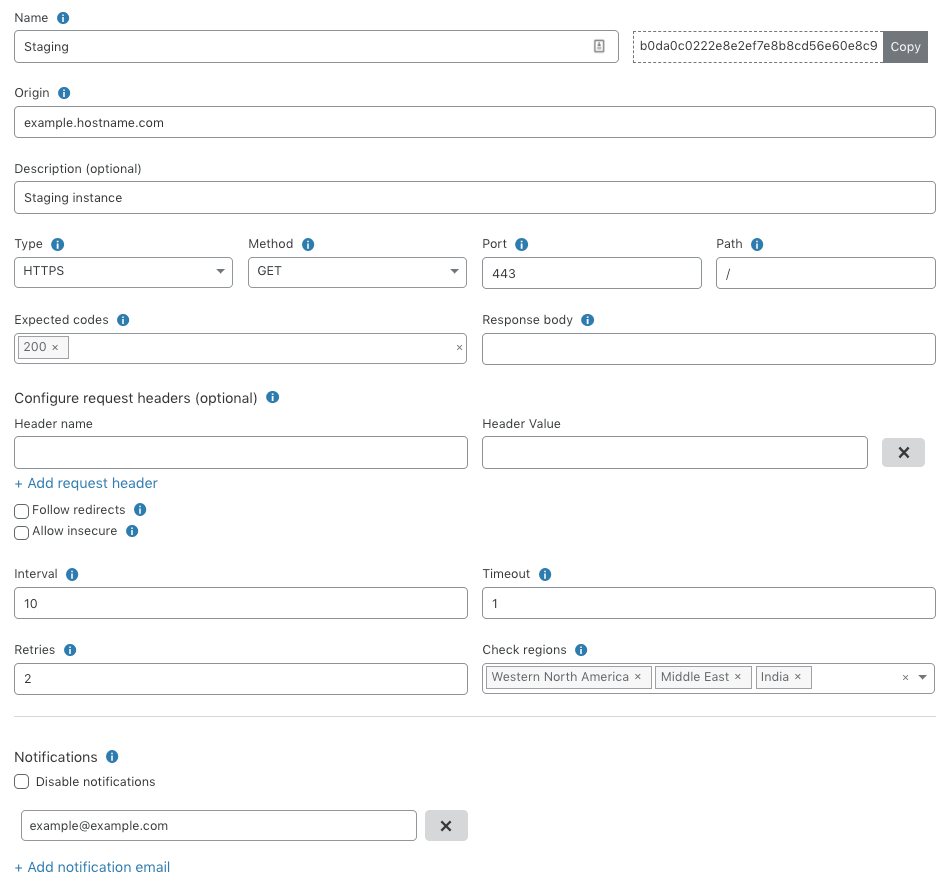
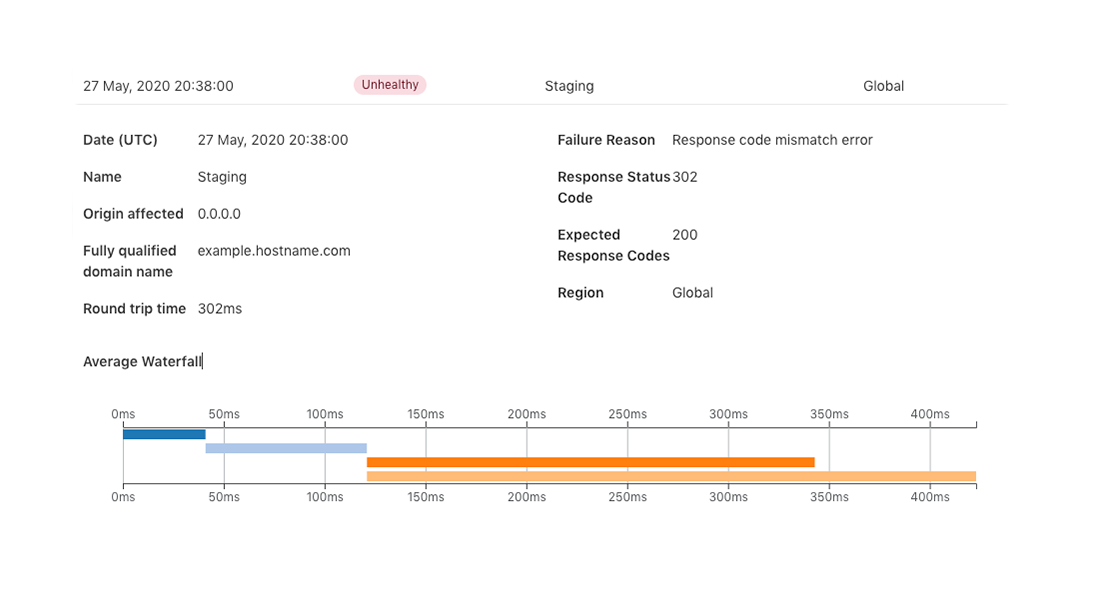
Once you set up a notification, you will be alerted when there is a change in the health of your origin server. In the example above, if your staging environment starts responding with anything other than a 200 OK response code, we will send you an email within seconds so you can take the necessary action before customers are impacted.
Introducing Standalone Health Check Analytics
Once you get the notification email, we provide tools that help to quickly debug the possible cause of the issue with detailed logs as well as data visualizations enabling you to better understand the context around the issue. Let’s walk through a real-world scenario and see how Health Check Analytics helps decrease our time to resolution.
A notification email has been sent to you letting you know that Staging is unhealthy. You log into your dashboard and go into Health Check Analytics for this particular Health Check. In the screenshot below, you can see that Staging is up 76% of the time vs 100% of the time for Production. Now that we see the graph validating the email notification that there is indeed a problem, we need to dig in further. Below the graph you can see a breakdown of the type of errors that have taken place in both the Staging and Production addresses over the specified time period. We see there is only one error taking place, but very frequently, in the staging environment - a TCP Connection Failed error, leading to the lower availability.
This starts to narrow the funnel for what the issue could be. We know that there is something wrong with either the Staging server’s ability to receive connections, maybe an issue during the SYN-ACK handshake, or possibly an issue with the router being used and not an issue with the origin server at all but instead receiving a down-stream consequence. With this information, you can quickly make the necessary checks to validate your hypothesis and minimize your time to resolution. Instead of having to dig through endless logs, or try to make educated guesses at where the issue could stem from, Health Check Analytics allows you to quickly hone in on detailed areas that could be the root cause. This in turn maximizes your application reliability but more importantly, keeps trust and brand expectation with your customers.
#insights #analytics #product news #data analytic