Performance Monitor is an oldie but goldie tool to analyze performance problems. In this article, we will learn how we can write Perfmon counter data to a SQL database through the ODBC connection.
Perfmon is a monitoring tool that helps to track resource usage and system performance metrics in real-time and it also allows us to write counters data into various file types. So that, we can analyze and troubleshoot the hardware and application issues. Perfmon includes various counters and these counters can be used to measure applications or system performances for the different resource types (CPU, Memory, DISK, etc.). However real-time counter monitoring is not a convenient option to figure out the performance issues because this method wastes time and does not help to figure out the big picture. For this reason, we need to collect the counter data for the long-periods and then analyze. Perfmon allows us to store counter data for the following file types:
- Binary file
- Text file (comma-separated)
- Text file (tab-separated)
Along with these file types, we can also write Perfmon counters data to the SQL database. With this option, we can query and analyze the collected counter data more easily with T-SQL. Besides, we can visualize this data with SQL Server Reporting Service (SSRS), Qlikview, or PowerBI.
To write Perfmon counters data into the SQL Server database we need to complete the following two steps.
- Create an ODBC connection
- Create a Data Collector Set
Firstly, we will look at some essential counters that can be used to troubleshoot SQL Server performance problems.
Useful Performance Monitor counters for SQL Server
Perfmon can be very helpful when we are diagnosing or troubleshooting SQL Server problems. The following counters can use to measure the performance of the SQL Server and every counter indicates different resource utilization related to the SQL Server or can indicate problems about the SQL Server
Processors: % Processor Time
This counter is used for tracking the percentage of the total processor utilization that works on non-idle threads. In general, we don’t expect this value to exceed %85. Otherwise, we should suspect a CPU problem.
System: Processor Queue Length
This counter shows the number of the threads that wait in the CPU queue and if this number is greater than two, it indicates a CPU bottleneck.
SQL Server: SQL Statistics\Batch Requests/sec
This counter shows the number of the SQL batches which are being performed per second. This counter is very useful to detect busy and unbusy times of the database server. Thus, we can schedule maintenance tasks in unbusy periods.
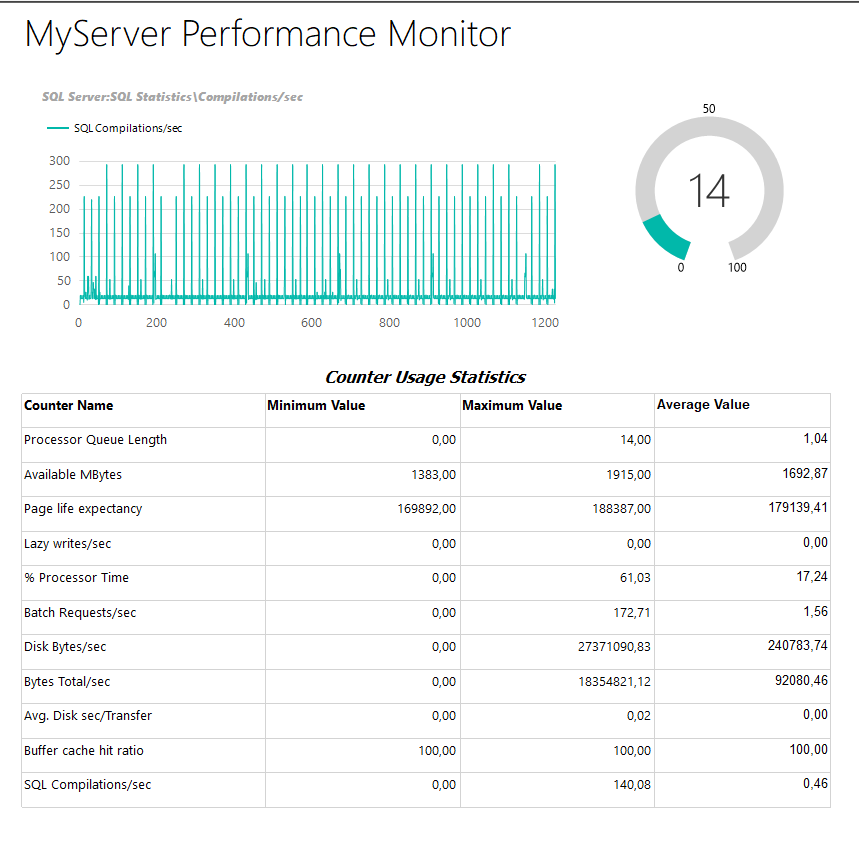
SQL Server: SQL Statistics\Compilations/sec
This counter shows the number of T-SQL queries compiled or re-compiled per second before they are executed. We should compare this counter value to the Batch Requests/sec metric to make the right decision. Compilations/sec should be %10 of the Batch Requests/sec or less than.
Network Interface: Bytes Total/Sec
This counter measures the total number of bytes that sent and received over the network adapter. It is a good indicator to analyze the utilization on the network adapter and this metric can be compared to the capacity of the network adapter.
PhysicalDisk: Avg. Disk sec/Transfer
This counter shows the total latency in milliseconds and it can be useful to interpret the performance of the storage systems.
PhysicalDisk: Disk Bytes/sec
This counter shows the total throughput of the disk subsystems in bytes.
Memory: Available Mbytes
This counter shows the amount of physical memory in megabytes that can be used by the operating system immediately for any application or process. On the ideal conditions, this value can be above 300MB.
SQL Server: Buffer Manager\Page Life Expectancy
This counter measures how long the data pages are kept in the buffer pool.
SQL Server: Buffer Manager\Buffer cache hit ratio
This counter measures the percentage of the pages found in the buffer pool.
SQL Server: Buffer Manager\Lazy writes/sec
This counter measures how many times the Lazy Writer process flushes dirty pages to the disk. The ideal value is zero and low values can be acceptable but if this value is greater than 20, we can consider a memory bottleneck.
#monitoring #performance counters #database