Hi everyone,
In this article, I will attempt to explain how we can find a confidence interval by using Bootstrap Method. Statistics and Python knowledge are needed for better understanding.
Before diving into the method, let’s remember some statistical concepts.
**Variance: **It is obtained by the sum of squared distances between a data point and the mean for each data point divided by the number of data points.
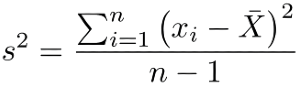
Sample variance
Standard Deviation: It is a measurement that shows us how our data points spread out from the mean. It is obtained by taking the square root of the variance
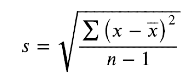
Sample standard deviation
Cumulative Distribution Function: It can be used on any kind of variable X(discrete, continuous, etc.). It shows us the probability distribution of a variable. Therefore allowing us to interpret the probability of a value less than or equal to x from a given probability distribution
Empirical Cumulative Distribution Function: Also known as Empirical Distribution Function. The only difference between CDF and ECDF is, while the former shows us the hypothetical distribution of any given population, the latter is based on our observed data.
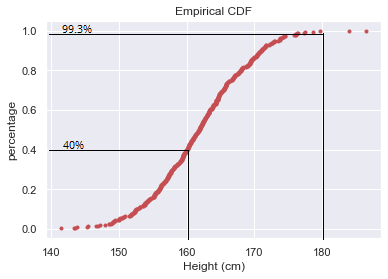
For example, how can we interpret the ECDF of the data shown on the chart above? We can say that 40% of heights are less than or equal to 160cm. Likewise, the percentage of people with heights of less than or equal to 180 cm is 99.3%
Probability Density Function: It shows us the distribution of continuous variables. The area under the curve gives us the probability so that the area must always be equal to 1
Normal Distribution: Also known as Gaussian Distribution. It is the most important probability distribution function in statistics which is bell-shaped and symmetric.
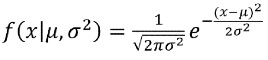
Normal (Gaussian) Distribution
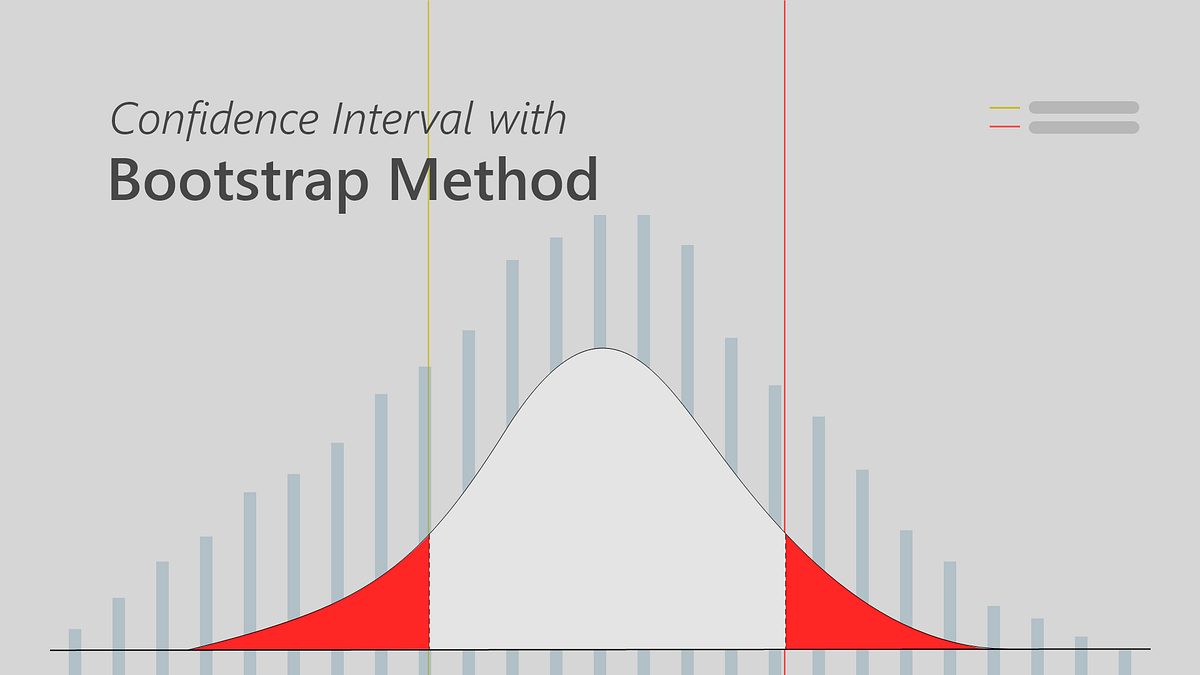
**_Confidence Interval: _**It is the range in which the values likely to exist in the population. It is estimated from the original sample and usually defined as 95% confidence but it may differ. You can consider the figure below which indicates a 95% confidence interval. The lower and upper limits of confidence interval defined by the values corresponding to the first and last 2.5th percentiles.
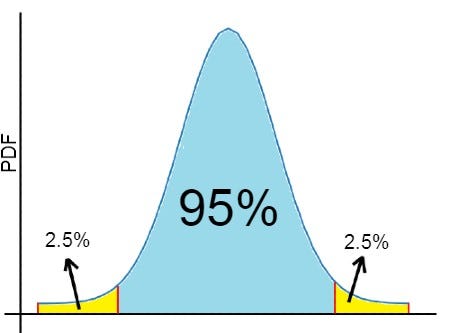
95% Confidence Interval, Image by author
What is Bootstrap Method?
Bootstrap Method is a resampling method that is commonly used in Data Science. It has been introduced by Bradley Efron in 1979. Mainly, it consists of the resampling our original sample with replacement (Bootstrap Sample) and generating Bootstrap replicates by using Summary Statistics.
Confidence Interval of people heights
In this article, we are going to work with one of the datasets in Kaggle. It is Weight-Height data sets. It contains height (in inches) and weight (in pounds) information of 10.000 people separated by gender.
If you would like to see the whole code, you can find the IPython notebook via this link.
We are going to use only heights of 500 randomly selected people and compute a 95% confidence interval by using Bootstrap Method
Let’s start with importing the libraries that we will need.
#bootstrap #bootstrapping #calculating