For this project, I want to create an interface that presents information relevant to my 401k investment in one place instead of having to switch between different platforms. My solution is to combine data from Fidelity Investment, Yahoo Finance, Morningstar, Investopedia and mutual fund universe data from Kaggle for both tracking and research purposes. Utilizing my current knowledge of the Google Cloud Platform, coupled with the power of Python and APIs, I created a Tableau dashboard that centralizes the data concerning my 401k portfolio that I’m most interested in.
- WHY CHOOSE ONE PRODUCT/TECHNOLOGY VERSUS ANOTHER
- SETUP OF THE WORKSPACE
- DESIGN WITH THE FINANCE FOCUS IN MIND
- MAKE MAGIC WITH TABLEAU
- NEXT STEPS
WHY CHOOSE ONE PRODUCT/TECHNOLOGY VERSUS ANOTHER
One lesson I’m still learning is to choose where and when to transform and store my data. For example, would it be more useful to store all price and return data from all the investment funds in BigQuery storage or Google Sheets?
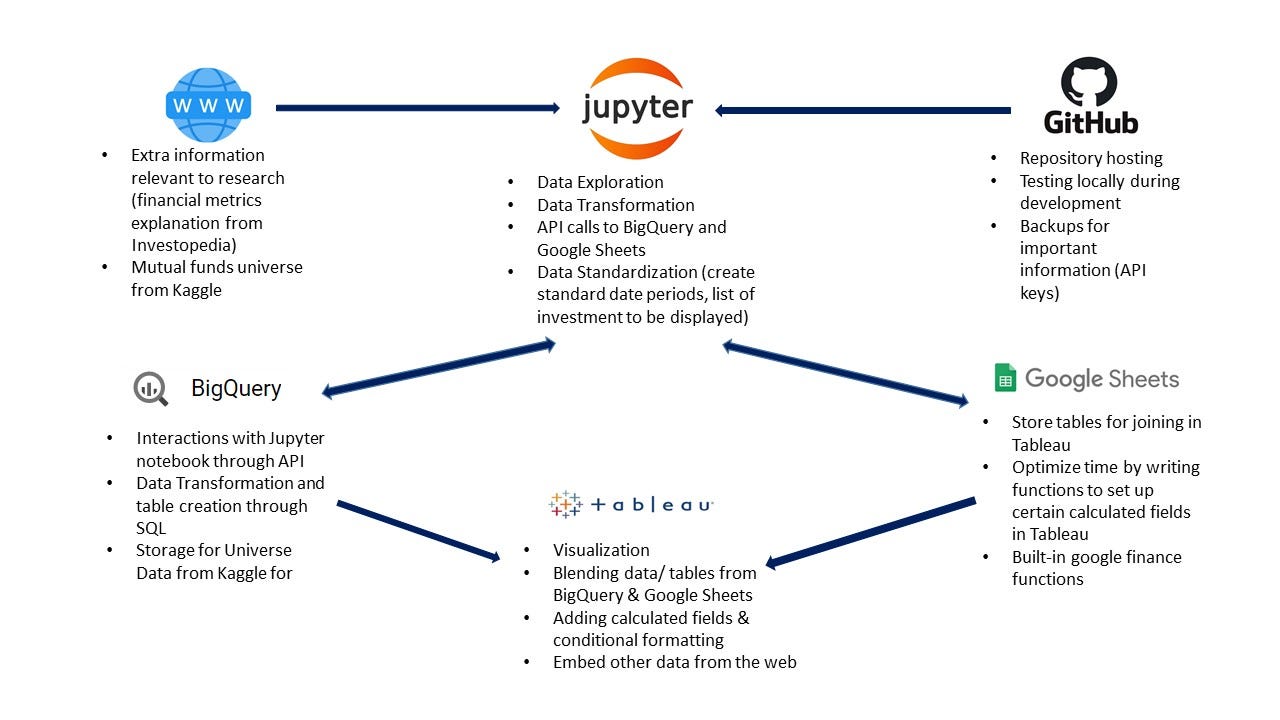
BigQuery would process much quicker but data transformations such as row operations (calculating daily log returns and portfolio weighted returns) would be much easier in Jupyter. This project is quite math heavy so it would help to be able to see the data on google sheets. Moreover, considering the built-in google finance functionsand the size of the data (about 40 individual investments), google sheets is a better choice. However, the universe data from Kaggle is massive and it would break Google Sheets so BigQuery storage is a better choice in this case. If there are complicated calculations involved, you could always read from BigQuery to Jupyter and then rewrite to BigQuery. Another thing to note is if you’re using Tableau Desktop with a public license, you can still follow this tutorial since you can make connections to Google Sheets without a problem though you won’t be able to connect to BigQuery. The data pipeline is presented below:
#jupyter-notebook #api #tableau #finance-and-banking #big-data #data-science