Higher resolution metrics are critical for monitoring dynamically changing environments and rapidly changing application metrics. Examples where high resolution metrics are critical include high volume e-commerce, live streaming, autoscaling bursty workloads on Kubernetes clusters, and more. Higher resolution custom, Prometheus, and agent metrics are now generally available, and can be written at a granularity of 10 seconds. Previously these metric types could only be written once every 60 seconds.
How to write Monitoring agent metrics at 10-second resolution
The Cloud Monitoring agent is a collectd-based daemon that collects system and application metrics from virtual machine instances and sends them to Cloud Monitoring. The Monitoring agent collects disk, CPU, network, and process metrics. By default, agent metrics are written at 60-second granularity. You can modify the agent collectd.conf configuration to send metrics at 10-second granularity by changing the Interval value to ‘10’ in the Monitoring agent’s collectd.conf file.
After making this change, you will need to restart your agent (this may differ based on your operating system and distro):
sudo service stackdriver-agent restart
Higher resolution agent metrics require Monitoring agent version 6.0.1 or greater. You can find documentation for determining your agent version here.
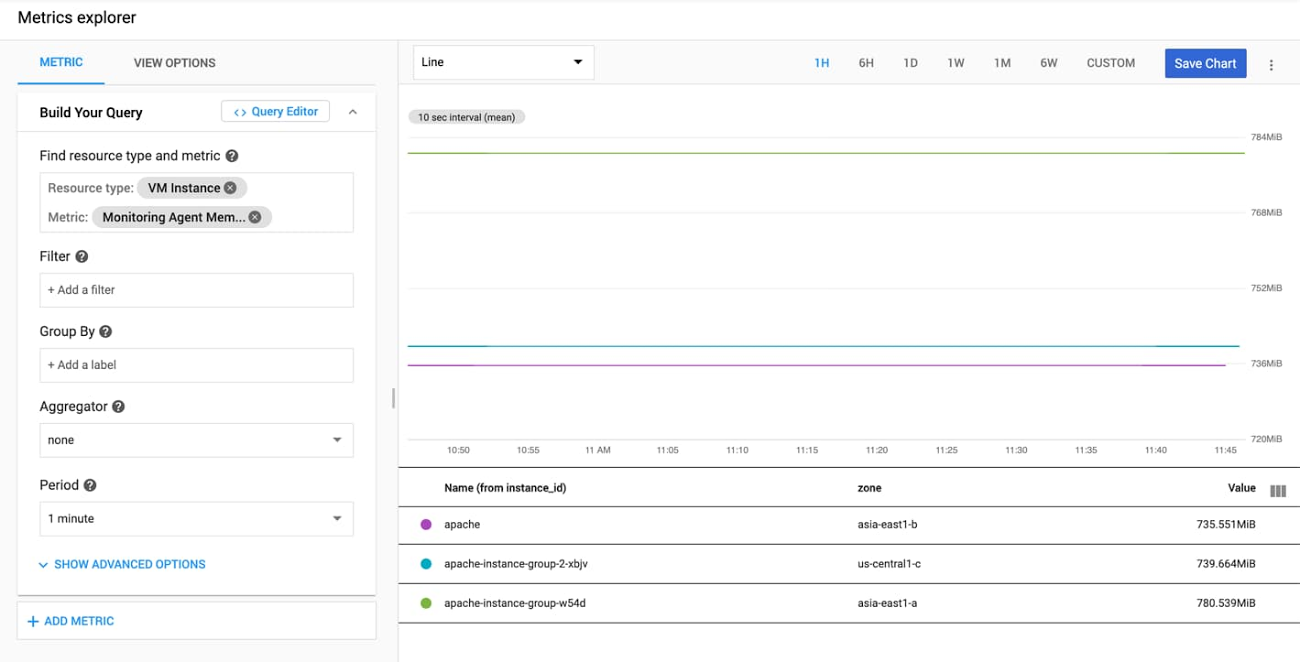
Now that your Monitoring agent is emitting metrics at 10-second granularity, you can view them in Metrics Explorer by searching for metrics with the prefix “agent.googleapis.com/agent/”.
How to write custom metrics at 10-second resolution
Custom metrics allow you to define and collect metric data that built-in Google Cloud metrics cannot provide. These could be specific to your application, infrastructure, or business. For example: “Latency of the shopping cart service” or “Returning customer rate” in an e-commerce application.
Custom metrics can be written in a variety of ways: via the Monitoring API, Cloud Monitoring client libraries, OpenCensus/OpenTelemetry libraries, or the Cloud Monitoring agent.
We recommend using the OpenCensus libraries to write custom metrics for several reasons:
- It is open source and supports a wide range of languages and frameworks.
- OpenCensus provides vendor-agnostic support for the collection of metric and trace data.
- OpenCensus provides optimized collection of points and batching of Monitoring API calls. It also handles timing API calls for 10-second resolution and other time intervals, so that the Monitoring API won’t reject points for being written too frequently. It also handles retries, exponential backoff, and more, helping to ensure that your metric points make it to the monitoring system.
- OpenCensus allows you to export the collected data to a variety of backend applications and monitoring services, including Cloud Monitoring.
#google cloud platform #management tools #cloud #cloud computing