In this project I am going to show how to build your own COVID dashboard in Google Colab using pandas and plotly.
Steps
- Install packages and tools
- Import the data
- Analyze the data
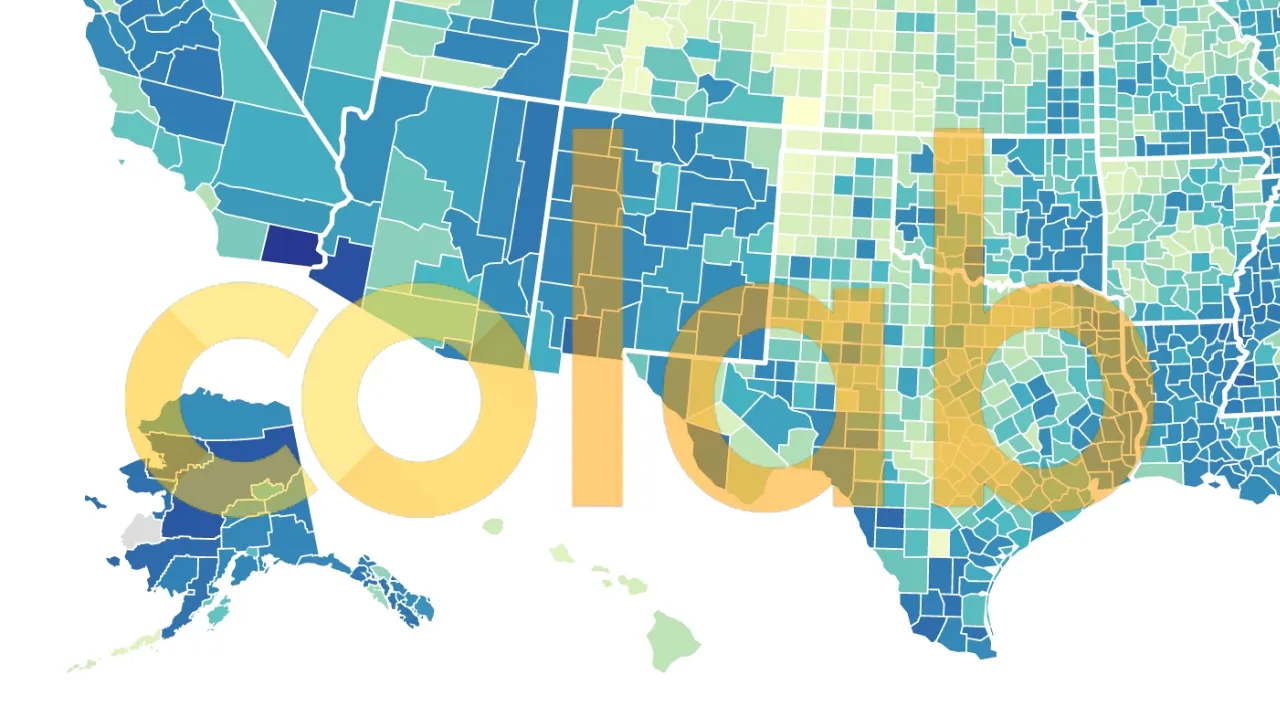
- Graphically present the data in US choropleth map
#colab #plotly #pandas #covid19 #google-colab
1.60 GEEK