Hello, brave readers, and welcome to a new series of mine called “Tackling Kaggle Tasks”. In this series I will be exploring the vast ocean of data that Kaggle has to offer and completing various tasks that each dataset owner puts forth pertaining to their submitted dataset. For this edition we will be taking on a dataset called “Solar Power Generation Data” submitted by one Ani Kannal. The dataset includes data records of two solar panel plant sites in India over a 34 day period. There are a total of 4 data files, 2 files for each plant site. One file includes that plant site’s power generation data, the second file includes that plant site’s sensor data such as temperature and irradiation levels. The dataset can be found here. The creator of the dataset asks Kaggle users to complete any of a list of four tasks, including Descriptive Analytics, Visualization and Further Exploration, Competition, and Tell a Story. In this article I will outline the process I took in completing the first of the four tasks, Descriptive Analytics.
Part 1 — Load the data, briefly explore each dataset, and understand and explore underlying patterns in the data
I began by creating separate dataframes for the four files provided to me and then analyzing the basic exploration and statistics of each. To do this I created a basic function that printed out a passed in dataframe’s first five rows of data, column names found in the dataframe, number of rows and columns in the dataframe, and a statistical summary of the dataframe, both numeric and non-numeric columns included.
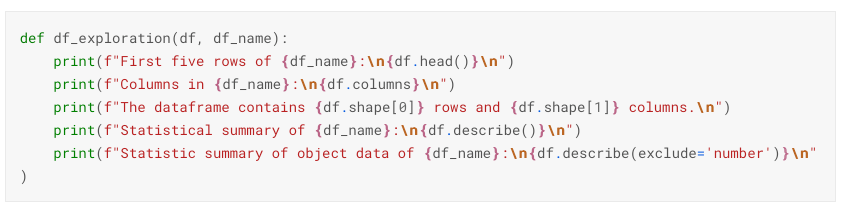
The function I created to output basic dataframe exploration and statistics
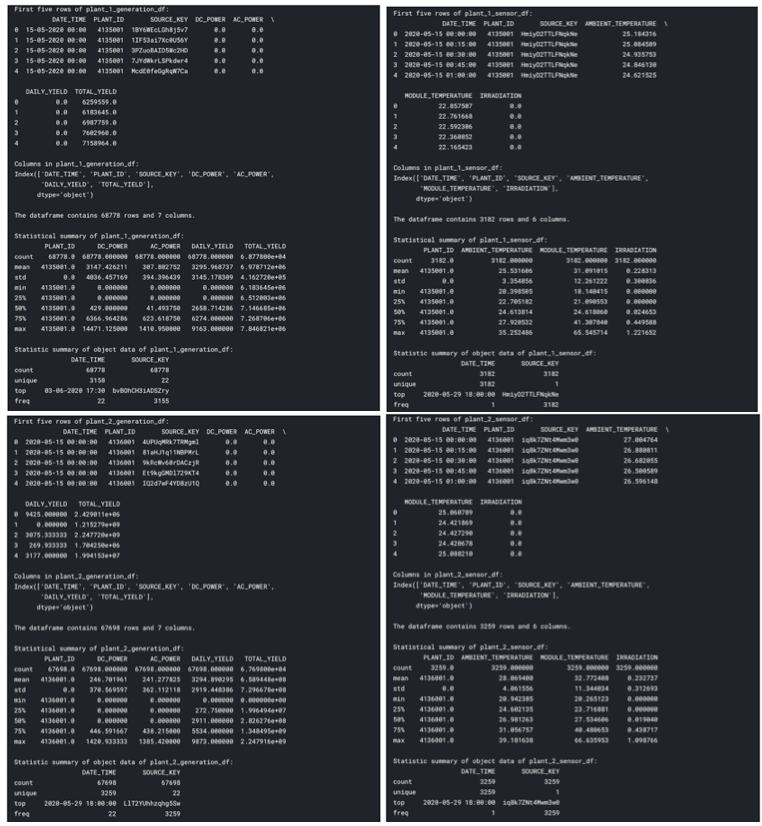
The outputs I recieved from running each dataframe through the above created function, from top left to bottom right: plant_1_generation_df, plant_1_sensor_df, plant_2_generation_df, plant_2_sensor_df
I then made a list of each column within the dataframes, pulling some information from what the author offered as well as doing some of my own minor research.
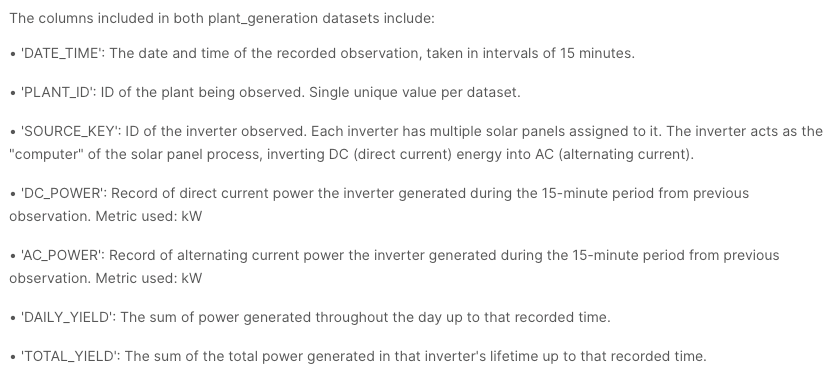
Column names and their descriptions found in the plant_generation data
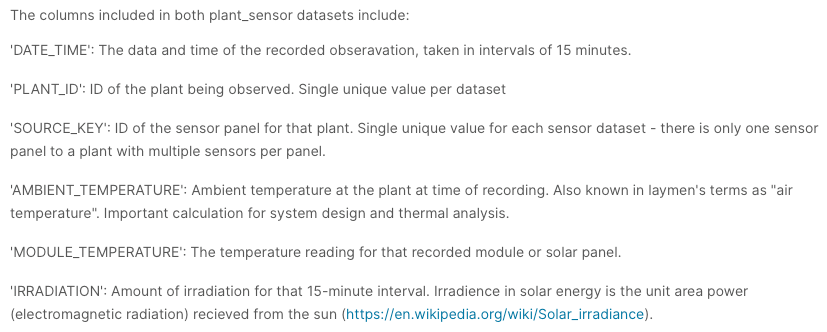
Column names and their descriptions found in the plant_sensor data — the link at the bottom is here.
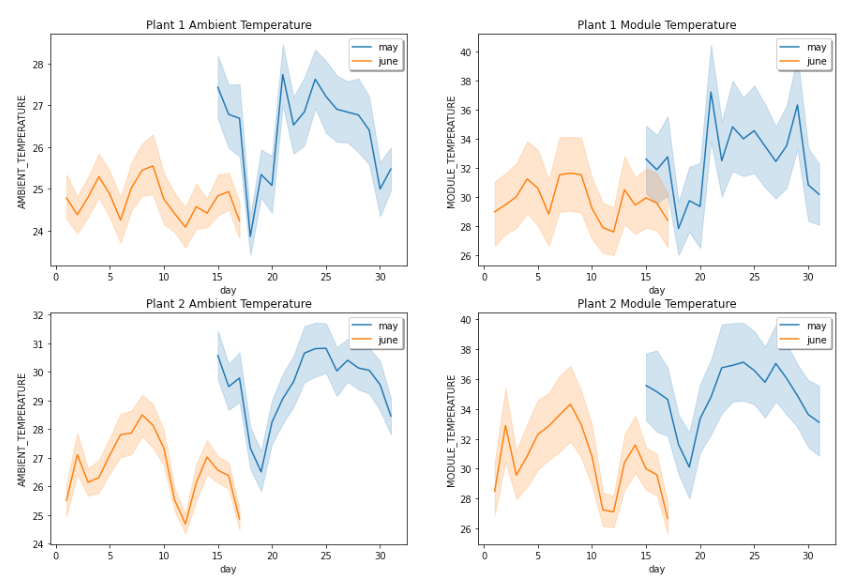
I followed this up by creating pair plots for each of my dataframes, eyeing the results and coming up with a number of base conclusions and hypotheses. First, given the pairplots for both plant_generation sets, I determined that DC power shows a near perfect positive correlation with AC power. This makes sense as the inverter makes the AC power dependent on the amount of DC power — its job is to invert DC to AC. Furthermore, I could see that DC and AC power both contribute to instances of DAILY_YIELD as well as TOTAL_YIELD, which intuitively makes sense as both DAILY_YIELD and TOTAL_YIELD should be direct results of AC/DC power.
#kaggle #data-science #descriptive-analytics #awesomeness #my-journey