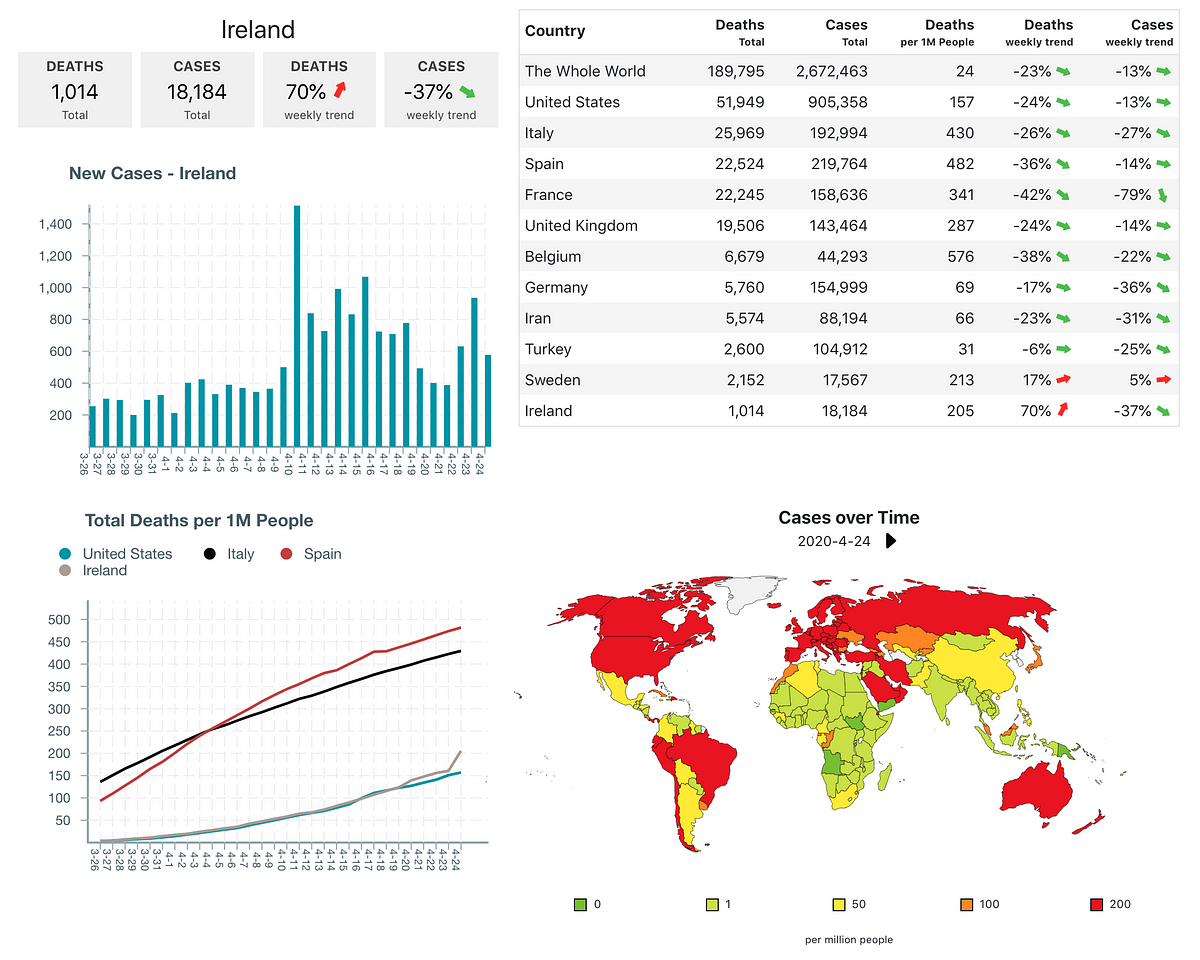
With extra time on offer during the COVID-19 pandemic I set out to write a dashboard that would let me customize everything, from the cities and countries to the types of data presented and even the layout. I was obsessed with pandemic data and wanted a tool to be able to easily create charts and graphs on the fly to share or illustrate points. I had not seen a dashboard that allowed such flexibility so that was my excuse for creating my own:
It is open source, hosted on Amazon S3, and distributed using their Cloudfront CDN. Every day a Lambda job runs to pull new data from the Johns Hopkins University repo on github. The application is a mere 500MB (transfer size) including data for all countries in the world and county-level data in the US. An initial version was up and running in a couple of weeks.
I am a retired tech entrepreneur and co-founder of Haven Life. I started out with punched cards and assembly language. For me the most interesting thing was the process of creating and distributing the app. I was surprised to find it a lot smoother than expected. It kept me sane during difficult times.
In this post, you’ll see how to Create a Coronavirus (COVID-19) Dashboard with React
#react #programming #javascript #redux #aws