Machine Learning: Building Recommender Systems
Machine-learning systems are usually built using different modules. These modules are combined in a particular way to achieve an end goal.
The scikit-learnthe library has functions that enable us to build these pipelines by concatenating various modules together. We just need to specify the modules along with the corresponding parameters. It will then build a pipeline using these modules that processes the data and trains the system.
The pipeline can include modules that perform various functions like feature selection, preprocessing, random forests, clustering, and so on. In this section, we will see how to build a pipeline to select the top K features from an input data point and then classify them using an Extremely Random Forest classifier.
Create a new Python file and import the following packages:
from sklearn.datasets import samples_generator
from sklearn.feature_selection import SelectKBest, f_regression
from sklearn.pipeline import Pipeline
from sklearn.ensemble import ExtraTreesClassifier
Let’s generate some labelled sample data for training and testing. The scikit-learn package has a built-in function that handles it. In the line to follow, we create 150 data points, where each data point is a 25-dimensional feature vector. The numbers in each feature vector will be generated using a random sample generator. Each data point has six informative features and no redundant features. Use the following code:
# Generate data
X, y = samples_generator.make_classification(n_samples=150,
        n_features=25, n_classes=3, n_informative=6,
        n_redundant=0, random_state=7)
The first block in the pipeline is the feature selector. This block selects the K best features. Let’s set the value of K to 9, as follows:
# Select top K features
k_best_selector = SelectKBest(f_regression, k=9)
The next block in the pipeline is an Extremely Random Forests classifier with 60 estimators and a maximum depth of four. Use the following code:
# Initialize Extremely Random Forests classifier
classifier = ExtraTreesClassifier(n_estimators=60, max_depth=4)
Let’s construct the pipeline by joining the individual blocks that we’ve constructed. We can name each block so that it’s easier to track:
# Construct the pipeline
processor_pipeline = Pipeline([('selector', k_best_selector), ('erf', classifier)])
We can change the parameters of the individual blocks. Let’s change the value of K in the first block to 7 and the number of estimators in the second block to 30. We will use the names we assigned in the previous line to define the scope:
# Set the parameters
processor_pipeline.set_params(selector__k=7, erf__n_estimators=30)
Train the pipeline using the sample data that we generated earlier:
# Training the pipeline
processor_pipeline.fit(X, y)
Predict the output for all the input values and print it:
# Predict outputs for the input data
output = processor_pipeline.predict(X)
print("\nPredicted output:\n", output)
Compute the score using the labeled training data:
# Print scores
print("\nScore:", processor_pipeline.score(X, y))
Extract the features chosen by the selector block. We specified that we wanted to choose 7 features out of 25. Use the following code:
# Print the features chosen by the pipeline selector
status = processor_pipeline.named_steps['selector'].get_support()

# Extract and print indices of selected features
selected = [i for i, x in enumerate(status) if x]
print("\nIndices of selected features:", ', '.join([str(x) for x in selected]))
The full code is given in the file pipeline_trainer.py. If you run the code, you will see the following output on your Terminal:
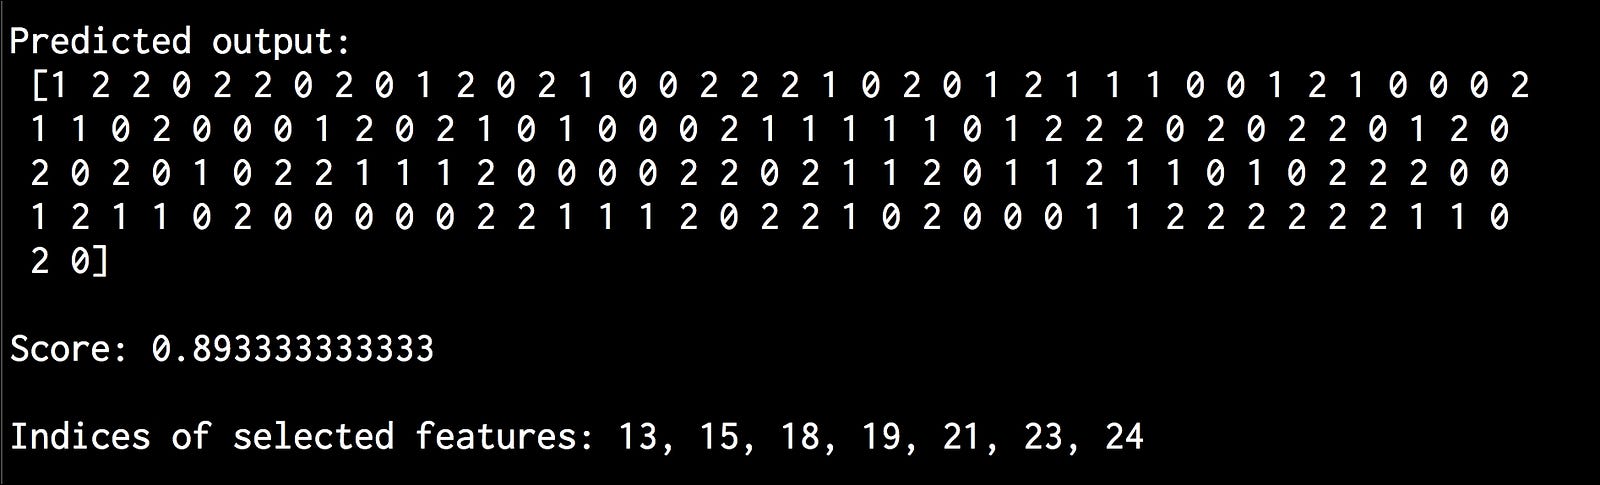
The predicted output list in the preceding screenshot shows the output labels predicted using the processor. The score represents the effectiveness of the processor. The last line indicates the indices of the chosen features.
Extracting the nearest neighbours
Recommender systems employ the concept of nearest neighbours to find good recommendations. Nearest neighbours refer to the process of finding the closest points to the input point from the given dataset. This is frequently used to build classification systems that classify a data point based on the proximity of the input data point to various classes. Let’s see how to find the nearest neighbours of a given data point.
Create a new Python file and import the following packages:
import numpy as np
import matplotlib.pyplot as plt
from sklearn.neighbors import NearestNeighbors
Define sample 2D data points:
# Input data
X = np.array([[2.1, 1.3], [1.3, 3.2], [2.9, 2.5], [2.7, 5.4], [3.8, 0.9],
        [7.3, 2.1], [4.2, 6.5], [3.8, 3.7], [2.5, 4.1], [3.4, 1.9],
        [5.7, 3.5], [6.1, 4.3], [5.1, 2.2], [6.2, 1.1]])
Define the number of nearest neighbours you want to extract:
# Number of nearest neighbors
k = 5
Define a test data point that will be used to extract the K nearest neighbours:
# Test datapoint
test_datapoint = [4.3, 2.7]
Plot the input data using circular shaped black markers:
# Plot input data
plt.figure()
plt.title('Input data')
plt.scatter(X[:,0], X[:,1], marker='o', s=75, color='black')
Create and train a K Nearest Neighbors model using the input data. Use this model to extract the nearest neighbours to our test data point:
# Build K Nearest Neighbors model
knn_model = NearestNeighbors(n_neighbors=k, algorithm='ball_tree').fit(X)
distances, indices = knn_model.kneighbors(test_datapoint)
Print the nearest neighbours extracted from the model:
# Print the 'k' nearest neighbors
print("\nK Nearest Neighbors:")
for rank, index in enumerate(indices[0][:k], start=1):
    print(str(rank) + " ==>", X[index])
Visualize the nearest neighbours:
# Visualize the nearest neighbors along with the test datapoint
plt.figure()
plt.title('Nearest neighbors')
plt.scatter(X[:, 0], X[:, 1], marker='o', s=75, color='k')
plt.scatter(X[indices][0][:][:, 0], X[indices][0][:][:, 1],
        marker='o', s=250, color='k', facecolors='none')
plt.scatter(test_datapoint[0], test_datapoint[1],
        marker='x', s=75, color='k')

plt.show()
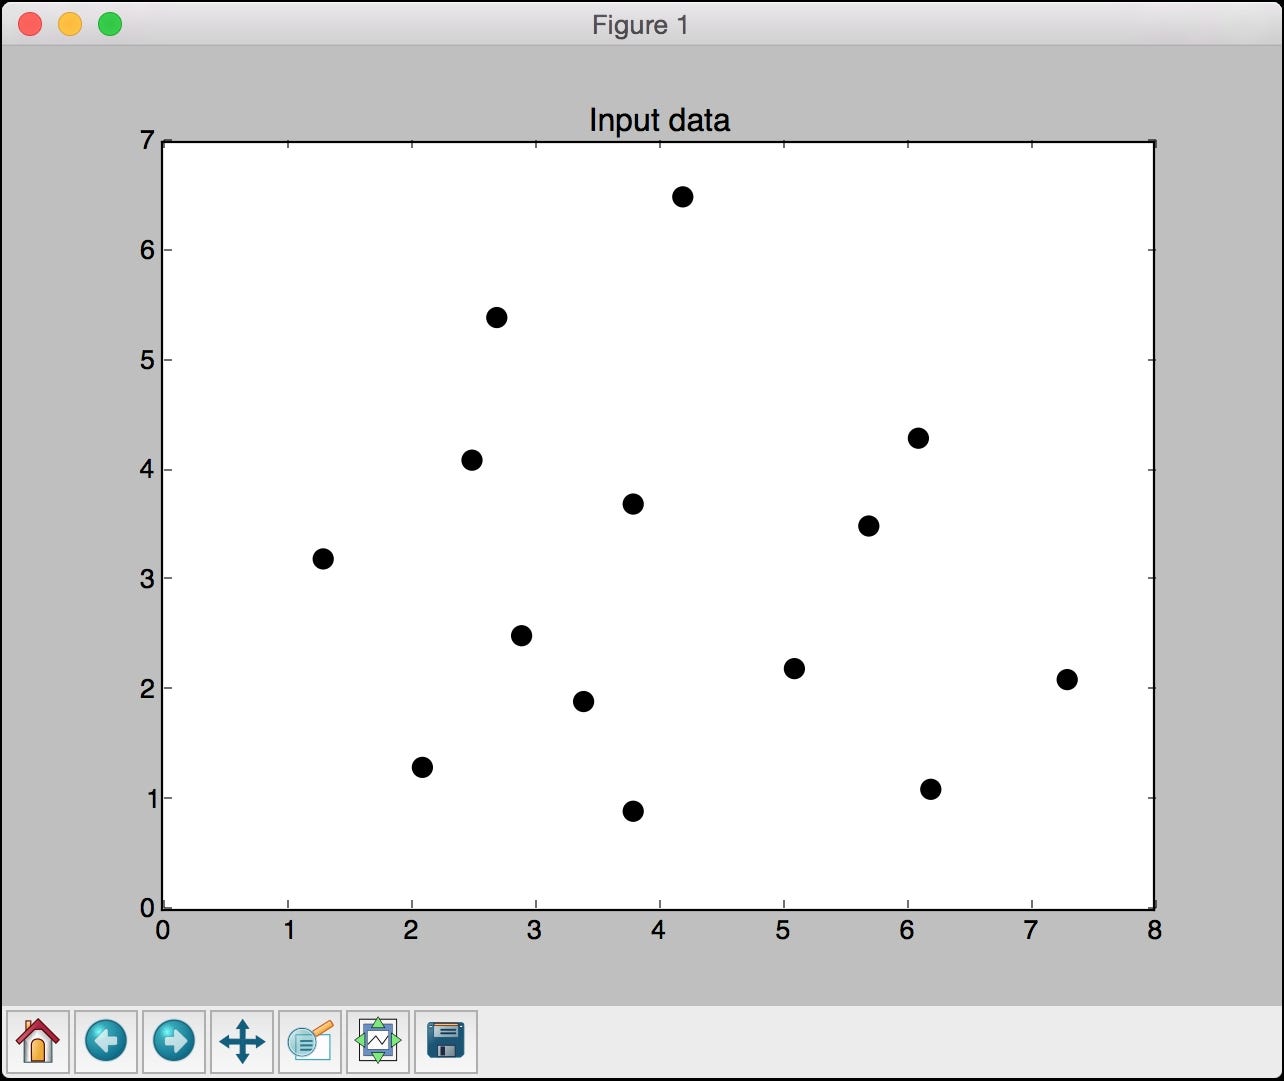
The full code is given in the file k_nearest_neighbors.py. If you run the code, you will see two screenshots. The first screenshot represents the input data:
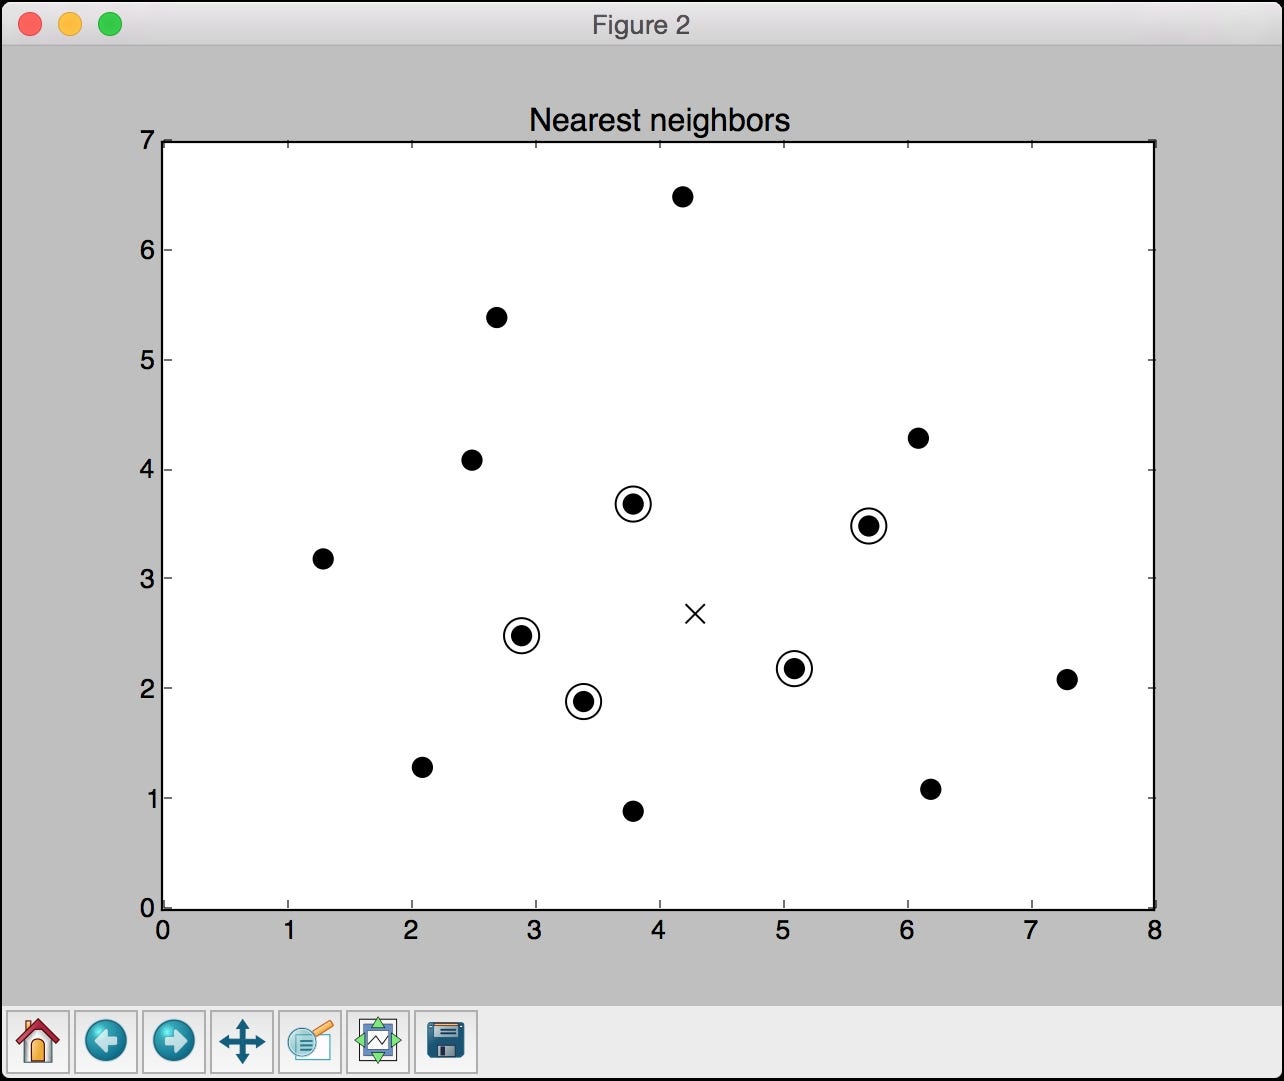
The second screenshot represents the five nearest neighbours. The test data point is shown using a cross and the nearest neighbour points have been circled:
You will see the following output on your Terminal:
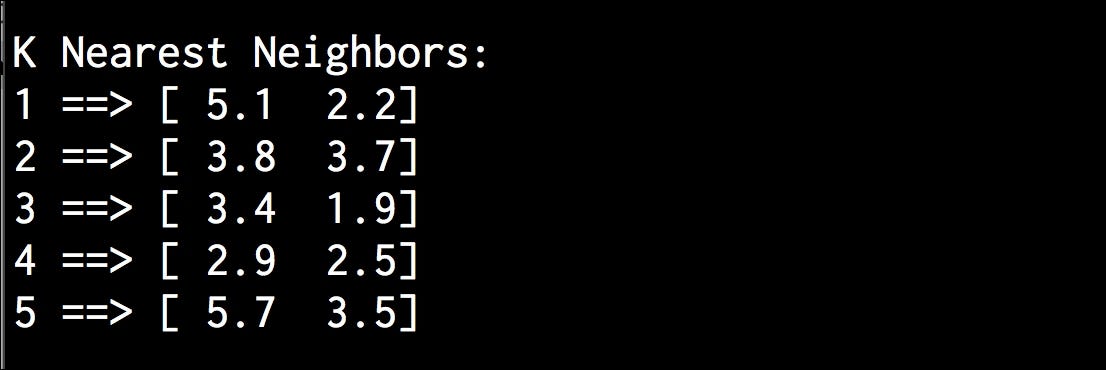
The preceding figure shows the five points that are closest to the test data point.
Building a K-Nearest Neighbors classifier
A K-Nearest Neighbors classifier is a classification model that uses the nearest neighbours algorithm to classify a given data point. The algorithm finds the Kclosest data points in the training dataset to identify the category of the input data point. It will then assign a class to this data point based on a majority vote. From the list of those K data points, we look at the corresponding classes and pick the one with the highest number of votes. Let’s see how to build a classifier using this model. The value K depends on the problem at hand.
Create a new Python file and import the following packages:
import numpy as np
import matplotlib.pyplot as plt
import matplotlib.cm as cm
from sklearn import neighbors, datasets
Load the input data from data.txt. Each line contains comma-separated values and the data contains four classes:
# Load input data
input_file = 'data.txt'
data = np.loadtxt(input_file, delimiter=',')
X, y = data[:, :-1], data[:, -1].astype(np.int)
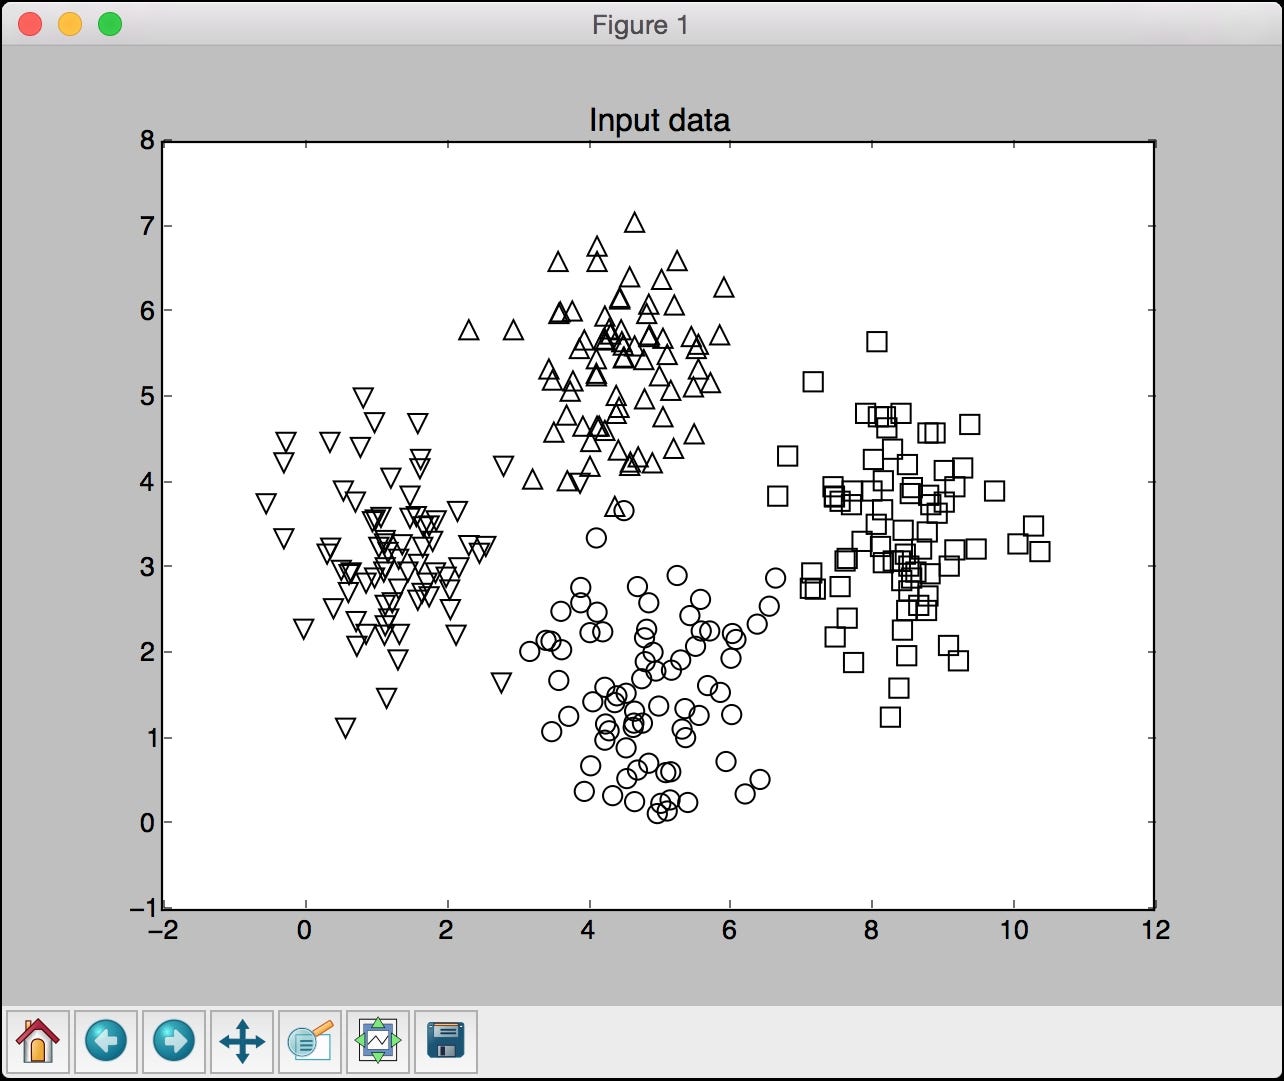
Visualize the input data using four different marker shapes. We need to map the labels to corresponding markers, which is where the mapper variable comes into the picture:
# Plot input data
plt.figure()
plt.title('Input data')
marker_shapes = 'v^os'
mapper = [marker_shapes[i] for i in y]
for i in range(X.shape[0]):
    plt.scatter(X[i, 0], X[i, 1], marker=mapper[i],
            s=75, edgecolors='black', facecolors='none')
Define the number of nearest neighbours we want to use:
# Number of nearest neighbors
num_neighbors = 12
Define the step size of the grid that will be used to visualize the boundaries of the classifier model:
# Step size of the visualization grid
step_size = 0.01
Create the K Nearest Neighbors classifier model:
# Create a K Nearest Neighbors classifier model
classifier = neighbors.KNeighborsClassifier(num_neighbors, weights='distance')
Train the model using training data:
# Train the K Nearest Neighbours model
classifier.fit(X, y)
Create the mesh grid of values that will be used to visualize the grid:
# Create the mesh to plot the boundaries
x_min, x_max = X[:, 0].min() - 1, X[:, 0].max() + 1
y_min, y_max = X[:, 1].min() - 1, X[:, 1].max() + 1
x_values, y_values = np.meshgrid(np.arange(x_min, x_max, step_size),
        np.arange(y_min, y_max, step_size))
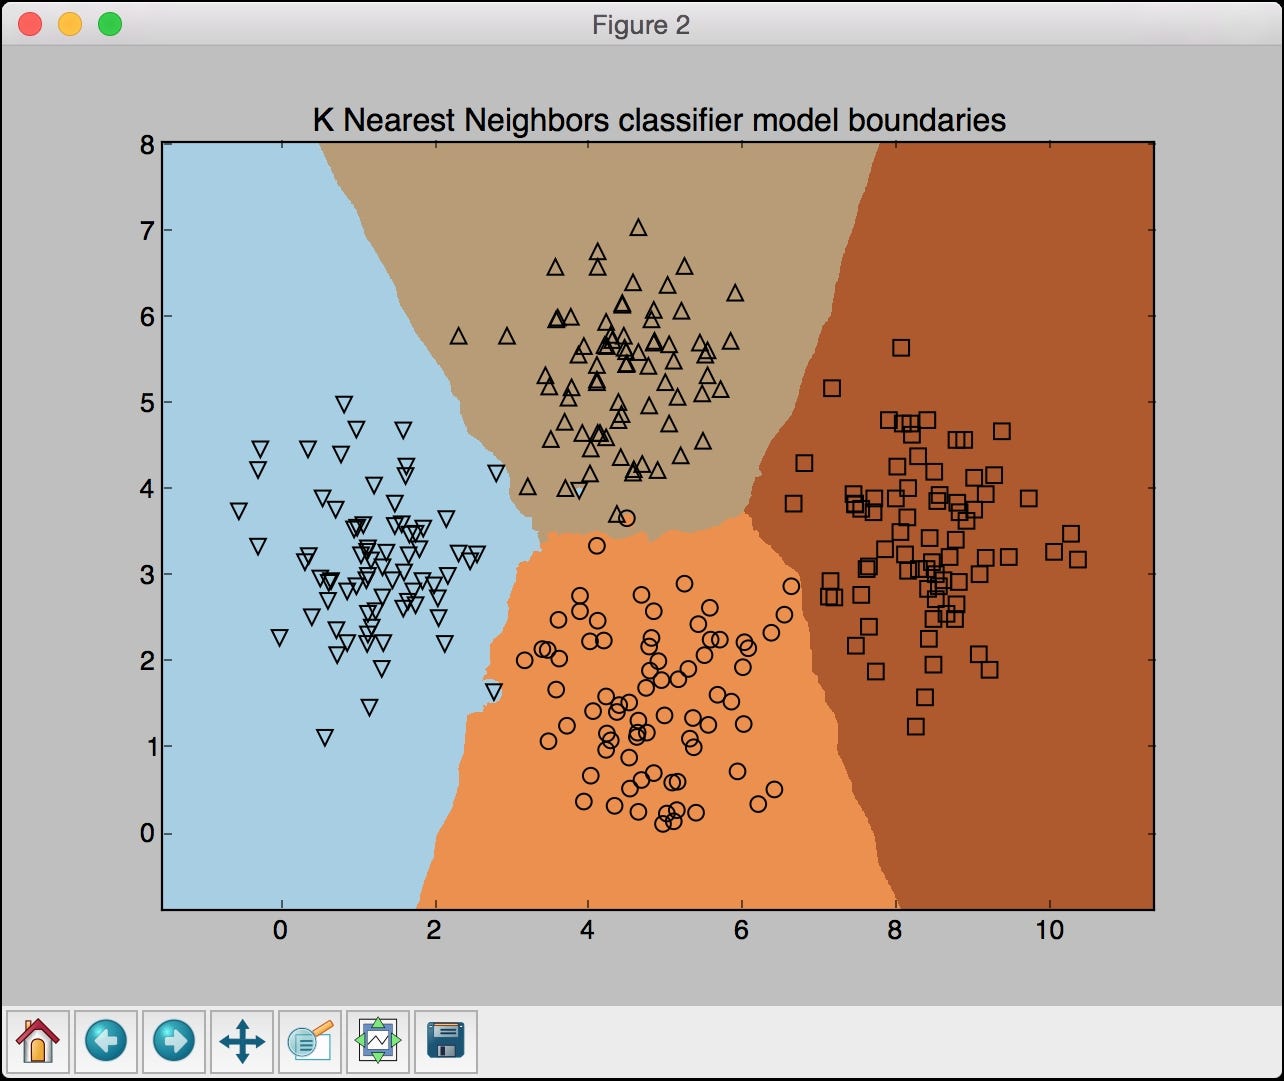
Evaluate the classifier on all the points on the grid to create a visualization of the boundaries:
# Evaluate the classifier on all the points on the grid
output = classifier.predict(np.c_[x_values.ravel(), y_values.ravel()])
Create a colour mesh to visualize the output:
# Visualize the predicted output
output = output.reshape(x_values.shape)
plt.figure()
plt.pcolormesh(x_values, y_values, output, cmap=cm.Paired)
Overlay training data on top of this colour mesh to visualize the data relative to the boundaries:
# Overlay the training points on the map
for i in range(X.shape[0]):
    plt.scatter(X[i, 0], X[i, 1], marker=mapper[i],
            s=50, edgecolors='black', facecolors='none')
Set the X and Y limits along with the title:
plt.xlim(x_values.min(), x_values.max())
plt.ylim(y_values.min(), y_values.max())
plt.title('K Nearest Neighbors classifier model boundaries')
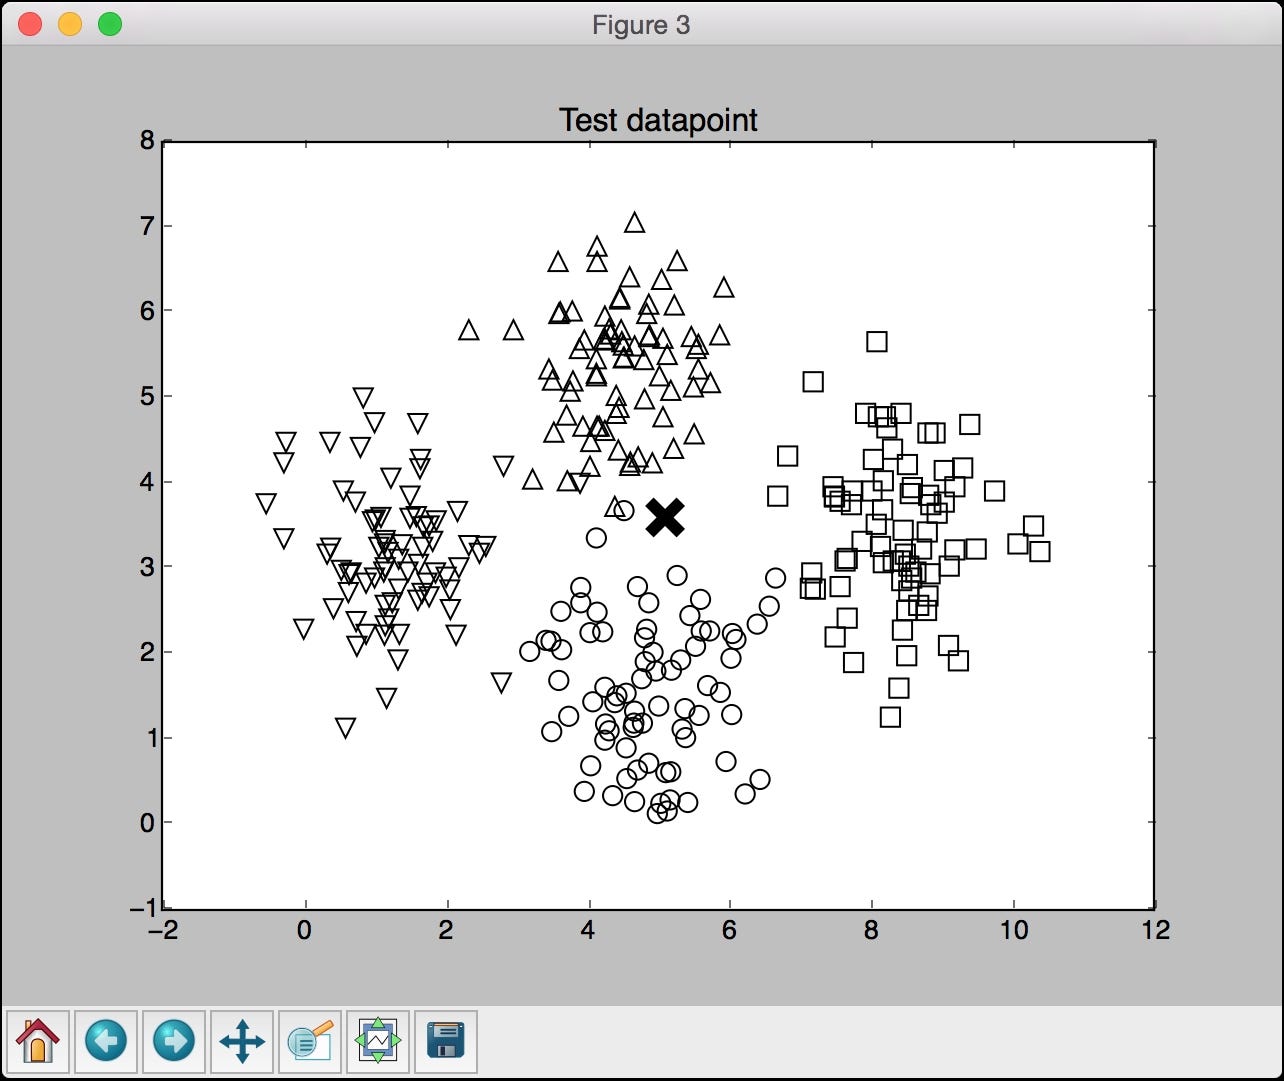
Define a test data point to see how the classifier performs. Create a figure with training data points and a test data point to see where it lies:
# Test input datapoint
test_datapoint = [5.1, 3.6]
plt.figure()
plt.title('Test datapoint')
for i in range(X.shape[0]):
    plt.scatter(X[i, 0], X[i, 1], marker=mapper[i],
            s=75, edgecolors='black', facecolors='none')

plt.scatter(test_datapoint[0], test_datapoint[1], marker='x',
        linewidth=6, s=200, facecolors='black')
Extract the K Nearest Neighbors to the test data point, based on the classifier model:
# Extract the K nearest neighbors
_, indices = classifier.kneighbors([test_datapoint])
indices = indices.astype(np.int)[0]
Plot the K nearest neighbours obtained in the previous step:
# Plot k nearest neighbors
plt.figure()
plt.title('K Nearest Neighbors')

for i in indices:
    plt.scatter(X[i, 0], X[i, 1], marker=mapper[y[i]],
            linewidth=3, s=100, facecolors='black')
Overlay the test data point:
plt.scatter(test_datapoint[0], test_datapoint[1], marker='x',
        linewidth=6, s=200, facecolors='black')
Overlay the input data:
for i in range(X.shape[0]):
    plt.scatter(X[i, 0], X[i, 1], marker=mapper[i],
            s=75, edgecolors='black', facecolors='none')
Print the predicted output:
print("Predicted output:", classifier.predict([test_datapoint])[0])

plt.show()
The full code is given in the file nearest_neighbors_classifier.py. If you run the code, you will see four screenshots. The first screenshot represents the input data:
The second screenshot represents the classifier boundaries:
The third screenshot shows the test data point relative to the input dataset. The test data point is shown using a cross:
The fourth screenshot shows the 12 nearest neighbours to the test data point:
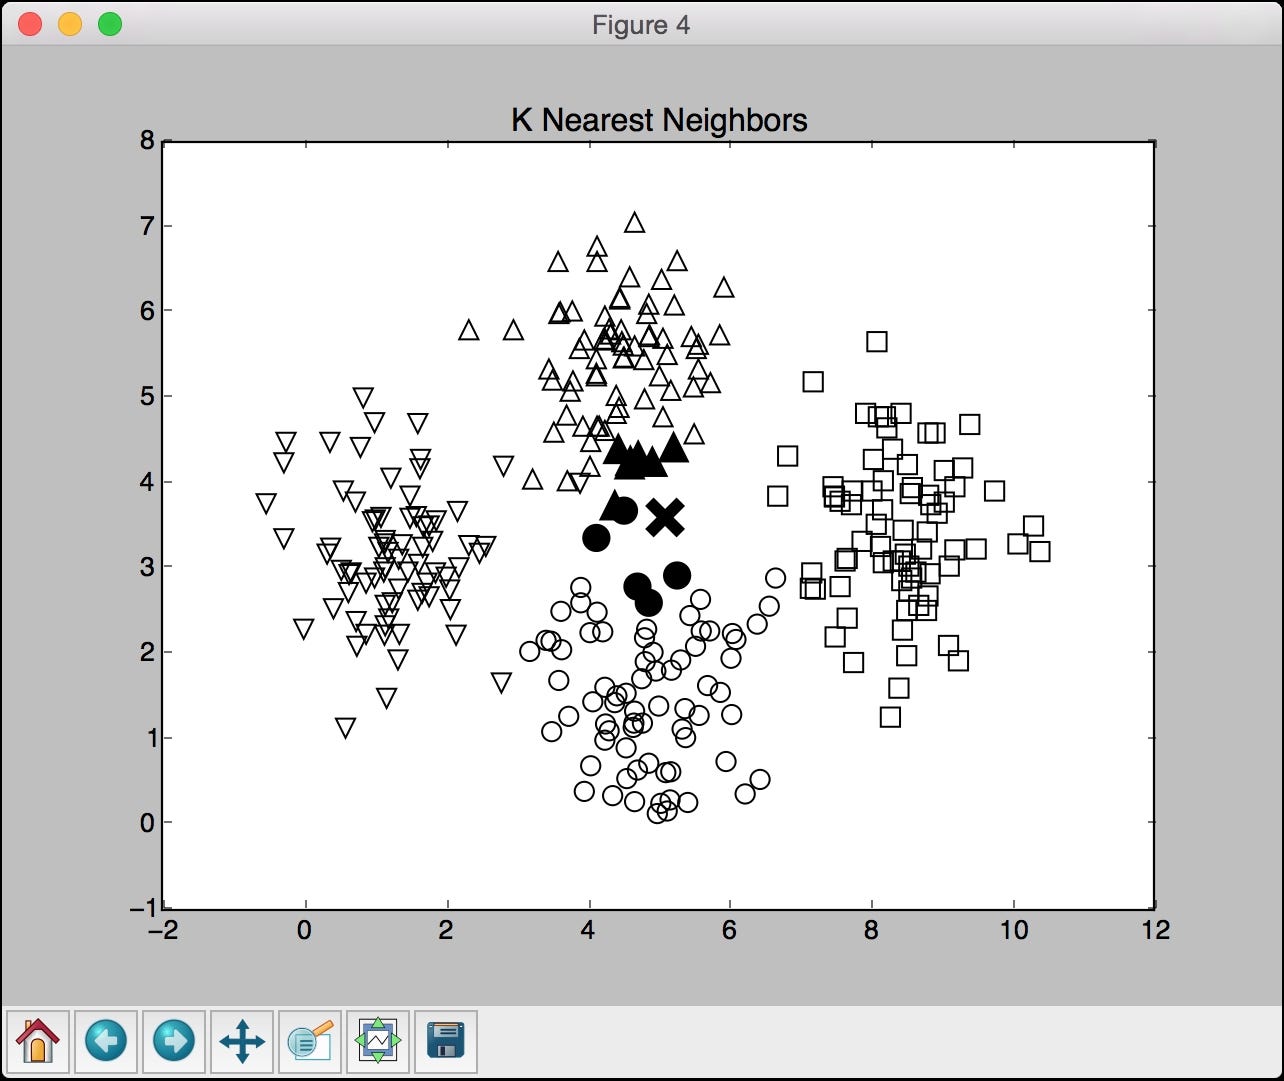
You will see the following output on the Terminal, indicating that the test data point belongs to a class 1:
Predicted output: 1
Computing similarity scores
In order to build a recommendation system, it is important to understand how to compare various objects in our dataset. Let’s say our dataset consists of people and their various movie preferences. In order to recommend something, we need to understand how to compare any two people with each other. This is where the similarity score becomes very important. The similarity score gives us an idea of how similar two objects are.
There are two scores that are used frequently in this domain — Euclidean score and Pearson score. The Euclidean score uses the Euclidean distance between two data points to compute the score. If you need a quick refresher on how Euclidean distance is computed, you can go to https://en.wikipedia.org/wiki/Euclidean_distance. The value of the Euclidean distance can be unbounded. Hence we take this value and convert it in a way that the Euclidean score ranges from 0 to 1. If the Euclidean distance between two objects is large, then the Euclidean score should be low because a low score indicates that the objects are not similar. Hence Euclidean distance is inversely proportional to Euclidean score.
Pearson score is a measure of the correlation between two objects. It uses the covariance between the two objects along with their individual standard deviations to compute the score. The score can range from -1 to +1. A score of +1 indicates that the objects are very similar where a score of -1 would indicate that the objects are very dissimilar. A score of 0 would indicate that there is no correlation between the two objects. Let’s see how to compute these scores.
Create a new Python file and import the following packages:
import argparse
import json
import numpy as np
Build an argument parser to process the input arguments. It will accept two users and the type of score that it needs to use to compute the similarity score:
def build_arg_parser():
    parser = argparse.ArgumentParser(description='Compute similarity score')
    parser.add_argument('--user1', dest='user1', required=True,
            help='First user')
    parser.add_argument('--user2', dest='user2', required=True,
            help='Second user')
    parser.add_argument("--score-type", dest="score_type", required=True,
            choices=['Euclidean', 'Pearson'], help='Similarity metric to be used')
    return parser
Define a function to compute the Euclidean score between the input users. If the users are not in the dataset, raise an error:
# Compute the Euclidean distance score between user1 and user2
def euclidean_score(dataset, user1, user2):
    if user1 not in dataset:
        raise TypeError('Cannot find ' + user1 + ' in the dataset')

    if user2 not in dataset:
        raise TypeError('Cannot find ' + user2 + ' in the dataset')
Define a variable to track the movies that have been rated by both the users:
# Movies rated by both user1 and user2
    common_movies = {}
Extract the movies rated by both users:
for item in dataset[user1]:
        if item in dataset[user2]:
            common_movies[item] = 1
If there are no common movies, then we cannot compute the similarity score:
# If there are no common movies between the users,
    # then the score is 0
    if len(common_movies) == 0:
        return 0
Compute the squared differences between the ratings and use it to compute the Euclidean score:
squared_diff = []

    for item in dataset[user1]:
        if item in dataset[user2]:
            squared_diff.append(np.square(dataset[user1][item] - dataset[user2][item]))

    return 1 / (1 + np.sqrt(np.sum(squared_diff)))
Define a function to compute the Pearson score between the input users in the given dataset. If the users are not found in the dataset, raise an error:
# Compute the Pearson correlation score between user1 and user2
def pearson_score(dataset, user1, user2):
    if user1 not in dataset:
        raise TypeError('Cannot find ' + user1 + ' in the dataset')

    if user2 not in dataset:
        raise TypeError('Cannot find ' + user2 + ' in the dataset')
Define a variable to track the movies that have been rated by both the users:
# Movies rated by both user1 and user2
    common_movies = {}
Extract the movies rated by both users:
for item in dataset[user1]:
        if item in dataset[user2]:
            common_movies[item] = 1
If there are no common movies, then we cannot compute the similarity score:
num_ratings = len(common_movies)

    # If there are no common movies between user1 and user2, then the score is 0
    if num_ratings == 0:
        return 0
Calculate the sum of ratings of all the movies that have been rated by both the users:
# Calculate the sum of ratings of all the common movies
    user1_sum = np.sum([dataset[user1][item] for item in common_movies])
    user2_sum = np.sum([dataset[user2][item] for item in common_movies])
Calculate the sum of squares of the ratings all the movies that have been rated by both the users:
# Calculate the sum of squares of ratings of all the common movies
    user1_squared_sum = np.sum([np.square(dataset[user1][item]) for item in common_movies])
    user2_squared_sum = np.sum([np.square(dataset[user2][item]) for item in common_movies])
Calculate the sum of products of the ratings of all the movies rated by both the input users:
# Calculate the sum of products of the ratings of the common movies
    sum_of_products = np.sum([dataset[user1][item] * dataset[user2][item] for item in common_movies])
Calculate the various parameters required to compute the Pearson score using the preceding computations:
# Calculate the Pearson correlation score
    Sxy = sum_of_products - (user1_sum * user2_sum / num_ratings)
    Sxx = user1_squared_sum - np.square(user1_sum) / num_ratings
    Syy = user2_squared_sum - np.square(user2_sum) / num_ratings
If there is no deviation, then the score is 0:
if Sxx * Syy == 0:
        return 0
Return the Pearson score:
return Sxy / np.sqrt(Sxx * Syy)
Define the main function and parse the input arguments:
if __name__=='__main__':
    args = build_arg_parser().parse_args()
    user1 = args.user1
    user2 = args.user2
    score_type = args.score_type
Load the ratings from the file ratings.json into a dictionary:
ratings_file = 'ratings.json'

    with open(ratings_file, 'r') as f:
        data = json.loads(f.read())
Compute the similarity score based on the input arguments:
if score_type == 'Euclidean':
        print("\nEuclidean score:")
        print(euclidean_score(data, user1, user2))
    else:
        print("\nPearson score:")
        print(pearson_score(data, user1, user2))
The full code is given in the file compute_scores.py. Let’s run the code with a few combinations. Let’s say we want to compute the Euclidean score between David Smith and Bill Duffy:
$ python3 compute_scores.py --user1 "David Smith" --user2 "Bill Duffy" --score-type Euclidean
If you run the above command, you will get the following output on your Terminal:
Euclidean score:
0.585786437627
If you want to compute the Pearson score between the same pair, run the following command on your Terminal:
$ python3 compute_scores.py --user1 "David Smith" --user2 "Bill Duffy" --score-type Pearson
You will see the following on your Terminal:
Pearson score:
0.99099243041
You can run it using other combinations of parameters as well.
Finding similar users using collaborative filtering
Collaborative filtering refers to the process of identifying patterns among the objects in a dataset in order to make a decision about a new object. In the context of recommendation engines, we use collaborative filtering to provide recommendations by looking at similar users in the dataset.
The assumption here is that if two people have similar ratings for a particular set of movies, then their choices in a set of new unknown movies would be similar too. By identifying patterns in those common movies, we make predictions about new movies. In the previous section, we learned how to compare different users in the dataset. We will use these scoring techniques to find similar users in our dataset. Collaborative filtering is typically used when we have huge datasets. These methods can be used for various verticals like finance, online shopping, marketing, customer studies, and so on.
Create a new Python file and import the following packages:
import argparse
import json
import numpy as np

from compute_scores import pearson_score
Define a function to parse the input arguments. The only input argument would be the name of the user:
def build_arg_parser():
    parser = argparse.ArgumentParser(description='Find users who are similar to the input user ')
    parser.add_argument('--user', dest='user', required=True,
            help='Input user')
    return parser
Define a function to find the users in the dataset that are similar to the given user. If the user is not in the dataset, raise an error:
# Finds users in the dataset that are similar to the input user
def find_similar_users(dataset, user, num_users):
    if user not in dataset:
        raise TypeError('Cannot find ' + user + ' in the dataset')
We have already imported the function to compute the Pearson score. Let’s use that function to compute the Pearson score between the input user and all the other users in the dataset:
# Compute Pearson score between input user
    # and all the users in the dataset
    scores = np.array([[x, pearson_score(dataset, user,
            x)] for x in dataset if x != user])
Sort the scores in descending order:
# Sort the scores in decreasing order
    scores_sorted = np.argsort(scores[:, 1])[::-1]
Extract the top num_users number of users as specified by the input argument and return the array:
# Extract the top 'num_users' scores
    top_users = scores_sorted[:num_users]

    return scores[top_users]
Define the main function and parse the input arguments to extract the name of the user:
if __name__=='__main__':
    args = build_arg_parser().parse_args()
    user = args.user
Load the data from the movie ratings file ratings.json. This file contains the names of people and their ratings for various movies:
ratings_file = 'ratings.json'

    with open(ratings_file, 'r') as f:
        data = json.loads(f.read())
Find the top three users who are similar to the user specified by the input argument. You can change it to any number of users depending on your choice. Print the output along with the scores:
print('\nUsers similar to ' + user + ':\n')
    similar_users = find_similar_users(data, user, 3)
    print('User\t\t\tSimilarity score')
    print('-'*41)
    for item in similar_users:
        print(item[0], '\t\t', round(float(item[1]), 2))
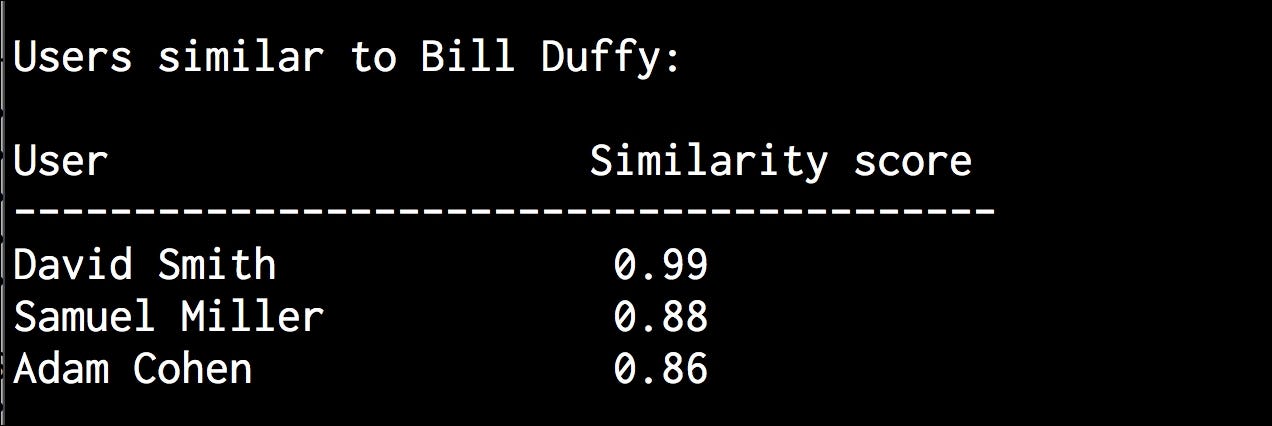
The full code is given in the file collaborative_filtering.py. Let’s run the code and find out the users who are similar to Bill Duffy:
$ python3 collaborative_filtering.py --user "Bill Duffy"
You will get the following output on your Terminal:
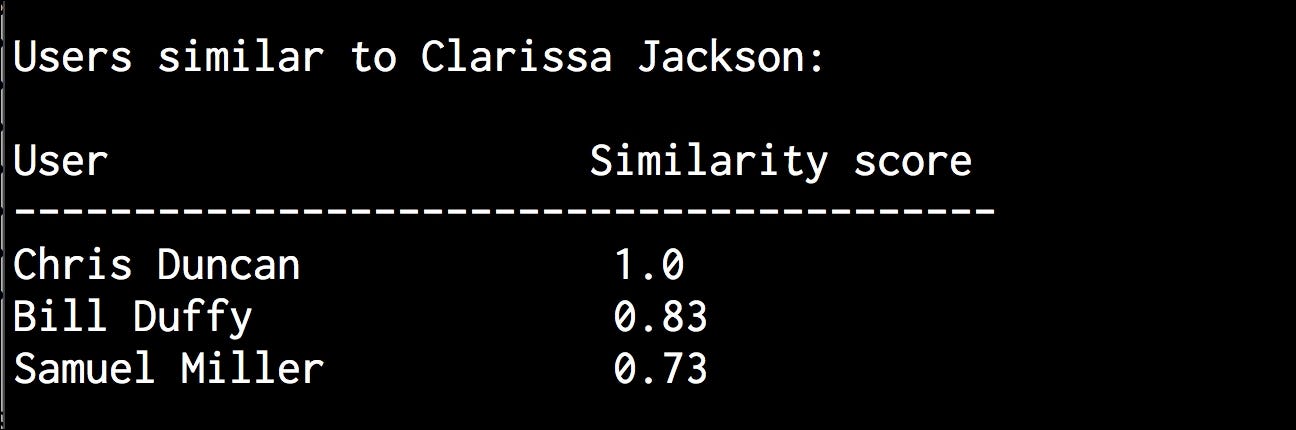
Let’s run the code and find out the users who are similar to Clarissa Jackson:
$ python3 collaborative_filtering.py --user "Clarissa Jackson"
You will get the following output on your Terminal:
Building a movie recommendation system
Now that we have all the building blocks in place, it’s time to build a movie recommendation system. We learned all the underlying concepts that are needed to build a recommendation system. In this section, we will build a movie recommendation system based on the data provided in the file ratings.json. This file contains a set of people and their ratings for various movies. When we want to find movie recommendations for a given user, we will need to find similar users in the dataset and then come up with recommendations for this person.
Create a new Python file and import the following packages:
import argparse
import json
import numpy as np

from compute_scores import pearson_score
from collaborative_filtering import find_similar_users
Define a function to parse the input arguments. The only input argument would be the name of the user:
def build_arg_parser():
    parser = argparse.ArgumentParser(description='Find the movie recommendations for the given user')
    parser.add_argument('--user', dest='user', required=True,
            help='Input user')
    return parser
Define a function to get the movie recommendations for a given user. If the user doesn’t exist in the dataset, raise an error:
# Get movie recommendations for the input user
def get_recommendations(dataset, input_user):
    if input_user not in dataset:
        raise TypeError('Cannot find ' + input_user + ' in the dataset')
Define the variables to track the scores:
overall_scores = {}
    similarity_scores = {}
Compute a similarity score between the input user and all the other users in the dataset:
for user in [x for x in dataset if x != input_user]:
        similarity_score = pearson_score(dataset, input_user, user)
If the similarity score is less than 0, you can continue with the next user in the dataset:
if similarity_score <= 0:
            continue
Extract a list of movies that have been rated by the current user but haven’t been rated by the input user:
filtered_list = [x for x in dataset[user] if x not in \
        dataset[input_user] or dataset[input_user][x] == 0]
For each item in the filtered list, keep a track of the weighted rating based on the similarity score. Also keep a track of the similarity scores:
for item in filtered_list:
            overall_scores.update({item: dataset[user][item] * similarity_score})
            similarity_scores.update({item: similarity_score})
If there are no such movies, then we cannot recommend anything:
if len(overall_scores) == 0:
        return ['No recommendations possible']
Normalize the scores based on the weighted scores:
# Generate movie ranks by normalization
    movie_scores = np.array([[score/similarity_scores[item], item]
            for item, score in overall_scores.items()])
Sort the scores and extract the movie recommendations:
# Sort in decreasing order
    movie_scores = movie_scores[np.argsort(movie_scores[:, 0])[::-1]]

    # Extract the movie recommendations
    movie_recommendations = [movie for _, movie in movie_scores]

    return movie_recommendations
Define the main function and parse the input arguments to extract the name of the input user:
if __name__=='__main__':
    args = build_arg_parser().parse_args()
    user = args.user
Load the movie ratings data from the file ratings.json:
ratings_file = 'ratings.json'

    with open(ratings_file, 'r') as f:
        data = json.loads(f.read())
Extract the movie recommendations and print the output:
print("\nMovie recommendations for " + user + ":")
    movies = get_recommendations(data, user)
    for i, movie in enumerate(movies):
        print(str(i+1) + '. ' + movie)
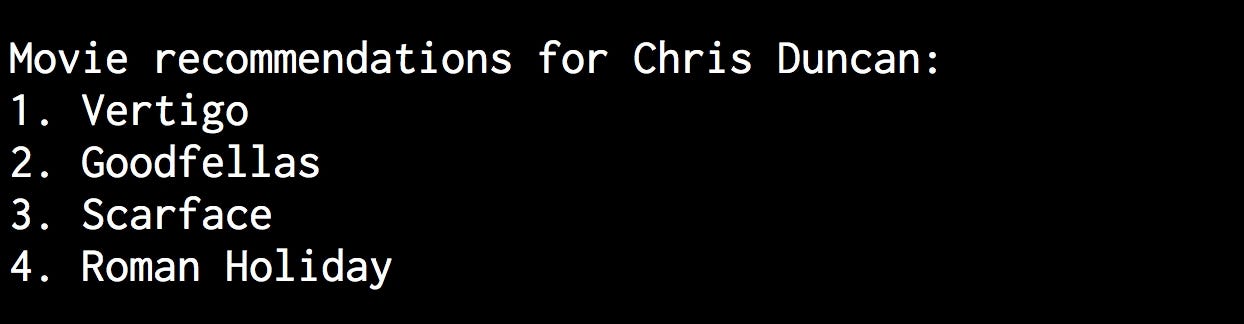
The full code is given in the file movie_recommender.py. Let’s find out the movie recommendations for Chris Duncan:
$ python3 movie_recommender.py --user "Chris Duncan"
You will see the following output on your Terminal:
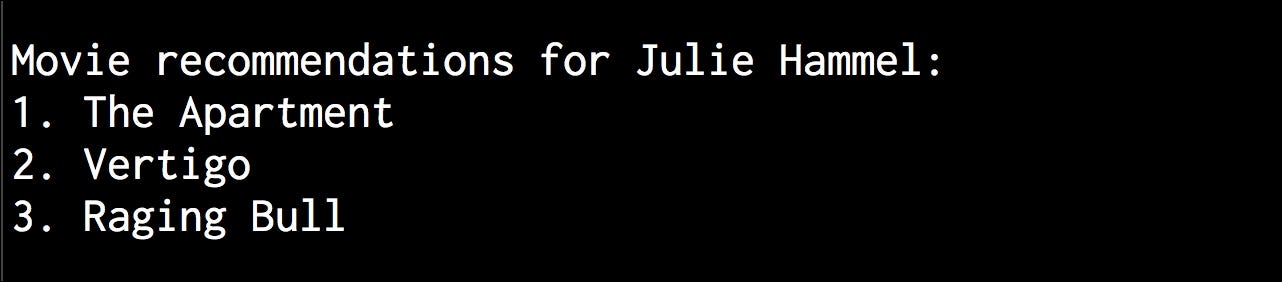
Let’s find out the movie recommendations for Julie Hammel:
$ python3 movie_recommender.py --user "Julie Hammel"
You will see the following output on your Terminal:
#machine-learning #data-science