If you have ever been tasked with productionalizing a machine learning model, you probably know that Scikit-Learn library offers one of the best ways — if not the best way — of creating production-quality machine learning workflows. The ecosystem’s Pipeline, ColumnTransformer, preprocessors, imputers & feature selection classes are powerful tools that transform raw data into model-ready features.
However, before anyone is going to let you deploy to production, you are going to want to have some rudimentary understanding of how the new model works. The most common way to explain how a black-box model works is by plotting feature names and importance values. If you have ever tried to extract the feature names from a heterogeneous dataset processed by ColumnTransformer, you know that this is no easy task. Exhaustive Internet searches have only brought to my attention where others have asked the same question or offered a partial answer, instead of yielding a comprehensive and satisfying solution.
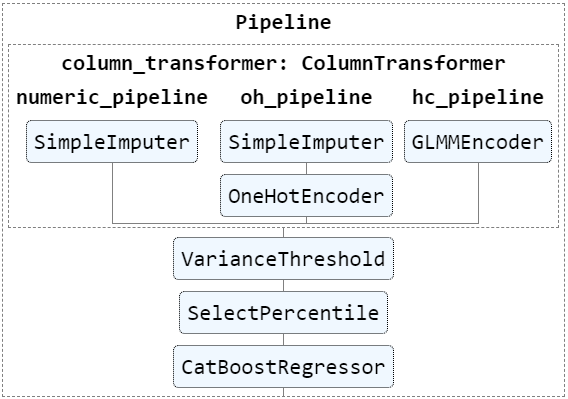
To remedy this situation, I have developed a class called FeatureImportance that will extract feature names and importance values from a Pipeline instance. It then uses the Plotly library to plot the feature importance using only a few lines of code. In this post, I will load a fitted Pipeline, demonstrate how to use my class and then give an overview of how it works. The complete code can be found here or at the end of this blog post.
There are two things I should note before continuing:
- I credit Joey Gao’s code on this thread with showing the way to tackle this problem.
- My post assumes that you have worked with Scikit-Learn and Pandas before and are familiar with how ColumnTransformer, Pipeline & preprocessing classes facilitate reproducible feature engineering processes. If you need a refresher, check out this Scikit-Learn example.
#programming #data-science #machine-learning