The Syncfusion Flutter Treemap is a data visualization widget. It visualizes flat and hierarchical data as tiles (rectangles) that are sized and colored based on the quantitative values. Its features include data binding, legends, data labels, tooltips, color mapping, layout types, drill-down, and more. This blog post explores the step-by-step process of how to visualize election results using the Flutter Treemap widget.
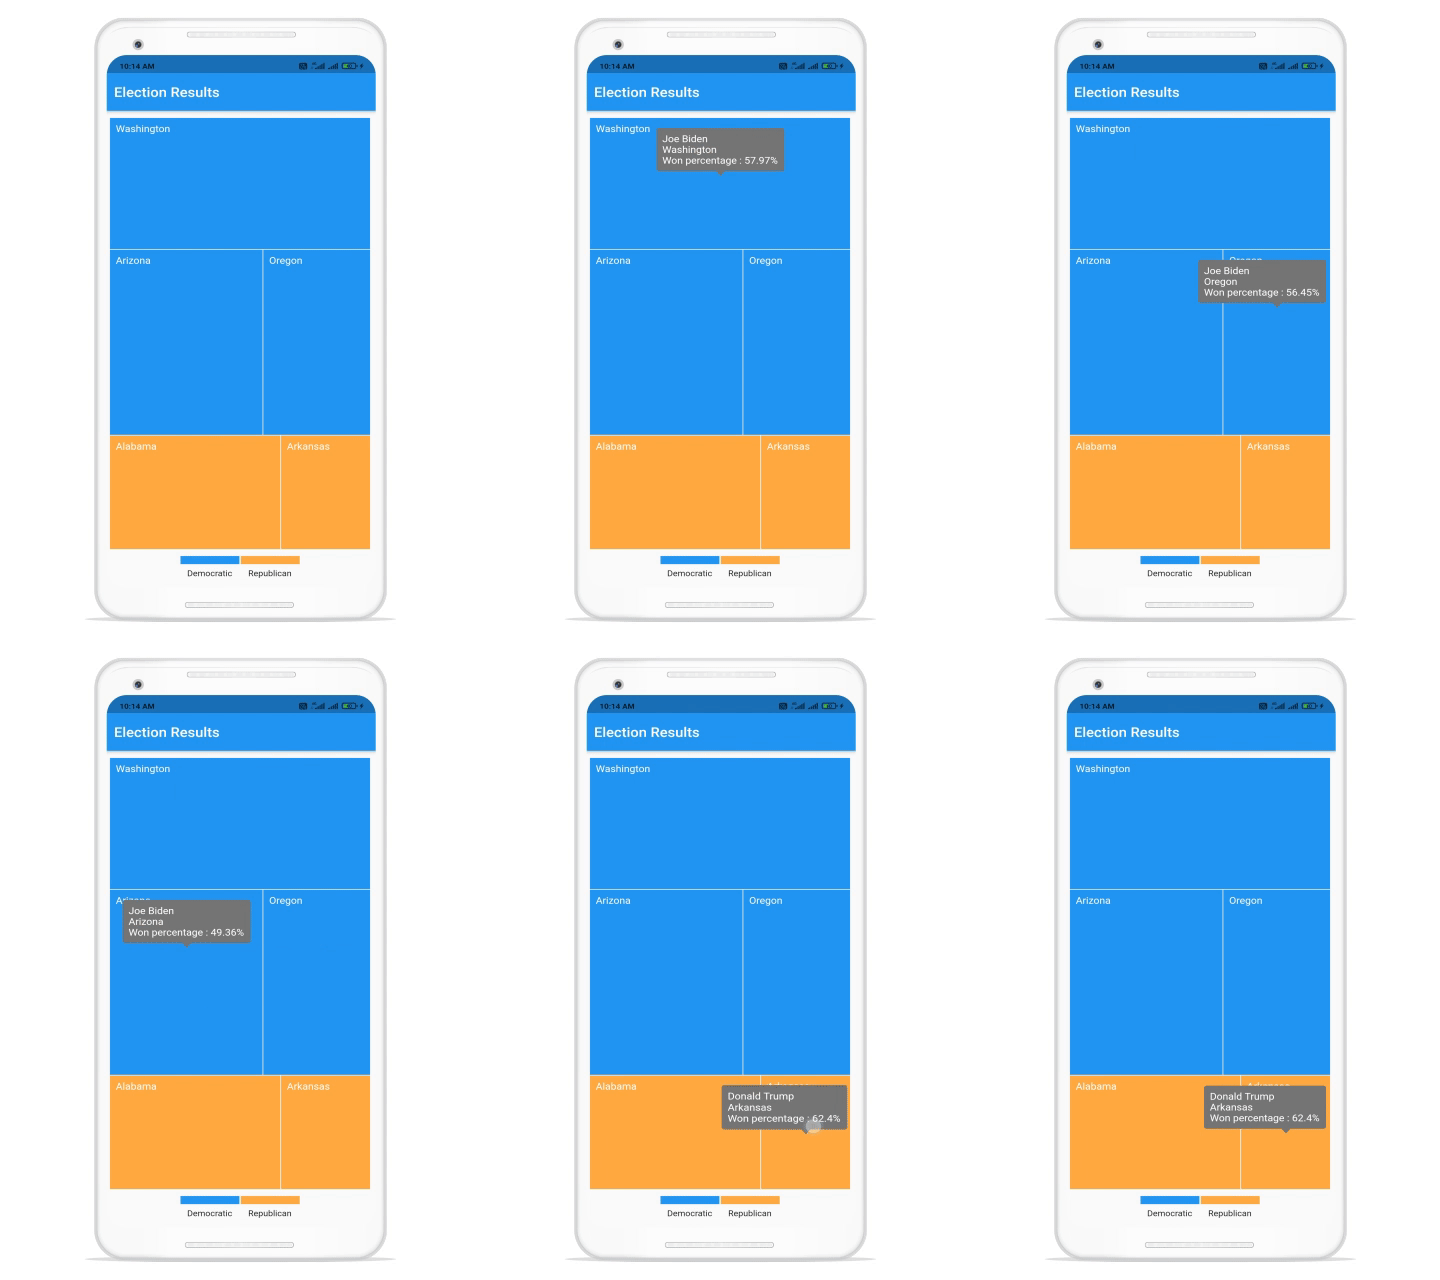
We are going to render a Treemap representing the presidential election of the United States with tiles, legends, a tooltip, and two different colors to represent the candidates. The following GIF image depicts the Treemap we will build in this blog.

Visualizing Election Results Using Flutter Treemap
Note: The Treemap information is sourced from the 2020 United States presidential election.
