The Ultimate Guide to Colors in R
We can visually improve our plots by coloring them. This is generally done with the col graphical parameter.
We can specify the name of the color we want as a string. For example, if we want our plot to be a red color, we pass col = "red".
Add Color to Plot in R
We use the following temp vector to create a barplot throughout this section.
# create a vector named temp
temp <- c(5,7,6,4,8)
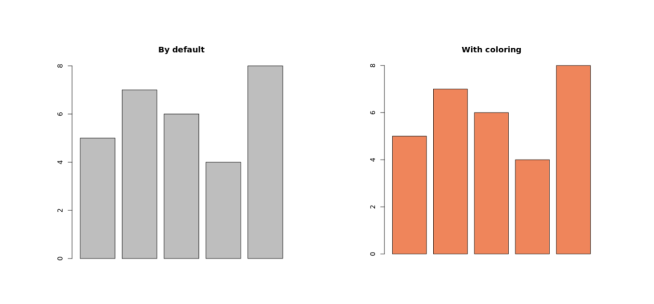
# barplot of temp without coloring
barplot(temp, main="By default")
# barplot of temp with coloring
barplot(temp, col="coral", main="With coloring")Output
Add Color to Plot
Here, we have passed col = "coral" inside the barplot() function to color our barplot with coral color.
Try replacing it with "green", "blue", "violet", etc. and look at the difference.
Using Color Names to Change Plot Color in R
R programming has names for 657 colors. We can take a look at them all with the colors() function, or simply check this R color pdf.
# display all color names
colors()
Output
[1] "white"           "aliceblue"        "antiquewhite"
[4] "antiquewhite1"   "antiquewhite2"    "antiquewhite3"
[7] "antiquewhite4"   "aquamarine"       "aquamarine1"
...
...
[649] "wheat3"        "wheat4"           "whitesmoke"
[652] "yellow"        "yellow1"          "yellow2"
[655] "yellow3"       "yellow4"          "yellowgreen"
Here, the colors() function returns a vector of all the color names in alphabetical order with the first element being "white".
We can color our plot by indexing this vector. For example, col=colors()[655] is the same as col="yellow3".
Using Hex Values as Colors in R
In R, instead of using a color name, color can also be defined with a hexadecimal value.
We define a color as a 6 hexadecimal digit number of the form #RRGGBB. Where the RR is for red, GG for green and BB for blue and value ranges from 00 to FF.
For example, #FF0000 would be red and #00FF00 would be green similarly, #FFFFFF would be white and #000000 would be black.
Let's take a look at how to implement hex values as colors in R,
# create a vector named temp
temp <- c(5,7,6,4,8)
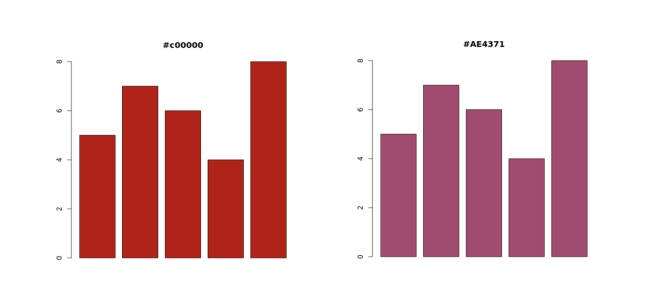
# using hex value #c00000
barplot(temp, col="#c00000", main="#c00000")
# using hex value #AE4371
barplot(temp, col="#AE4371", main="#AE4371")Output
Using Hex Values as Colors
In the above example, we have passed the hex value for the col parameter inside the barplot() function.
Here,
#c00000- this hex is composed of 75.3% red, 0% green and 0% blue#AE4371- this hex is composed of 68.24% red, 26.27% green and 44.31% blue
Using RGB Values to Color Plot in R
The rgb() function in R allows us to specify red, green and blue components with a number between 0 and 1.
This function returns the corresponding hex code discussed above. For example,
rgb(0, 1, 0) # prints "#00FF00"

rgb(0.3, 0.7, 0.9) # prints "#4DB3E6"
We can directly pass rgb() to the col parameter as:
# create a vector named temp
temp <- c(5,7,6,4,8)
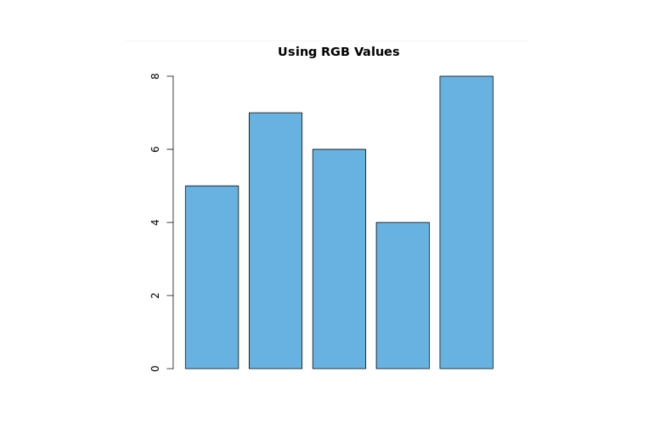
# using rgb() to color barplot
barplot(temp, col = rgb(0.3, 0.7, 0.9), main="Using RGB Values")Output
Using RGB Values as Colors
Here, we have passed rbg() to the col parameter inside barplot().
So the plot is colored according to the rgb value.
Color Cycling in R
We can color each bar of the barplot with a different color by providing a vector of colors.
If the number of colors provided is less than the number of bars, the color vector is recycled. For example,
# create a vector named temp
temp <- c(5,7,6,4,8)
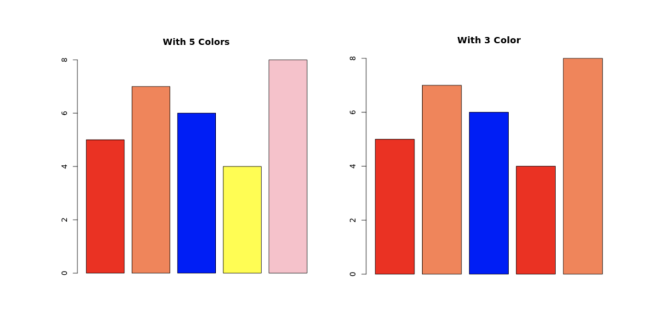
# color with 5 different colors
barplot(temp, col=c("red", "coral", "blue", "yellow", "pink"), main="With 5 Colors")
# color with 3 different color, last two bars will be recycled
barplot(temp, col=c("red", "coral", "blue"), main="With 3 Color")Output
Color Cycle
In the above example, at first we colored each bar of the barplot by providing a vector with 5 colors for 5 different bars.
For the second barplot, we have provided a vector with 3 different colors, so the color is recycled for the last 2 bars.
Using Color Palette in R
R programming offers 4 built in color palettes which can be used to quickly generate color vectors of desired length.
They are: rainbow(), heat.colors(), terrain.colors(), and topo.colors(). We pass in the number of colors that we want.
Let's take a look at the example,
# use rainbow() to generate color palette
rainbow(5)

# Output: "#FF0000FF" "#CCFF00FF" "#00FF66FF" "#0066FFFF" "#CC00FFFF"
Here, notice that the hexadecimal numbers are 8 digits long. The last two digits are the transparency level with FF being opaque and 00 being fully transparent.
Example: Using Color Palette in R
# create a vector named temp
temp <- c(5,7,6,4,8)

# using rainbow()
barplot(temp, col=rainbow(5), main="rainbow")

# using heat.colors()
barplot(temp, col=heat.colors(5), main="heat.colors")

# using terrain.colors()
barplot(temp, col=terrain.colors(5), main="terrain.colors")

# using topo.colors()
barplot(temp, col=topo.colors(5), main="topo.colors")
Output
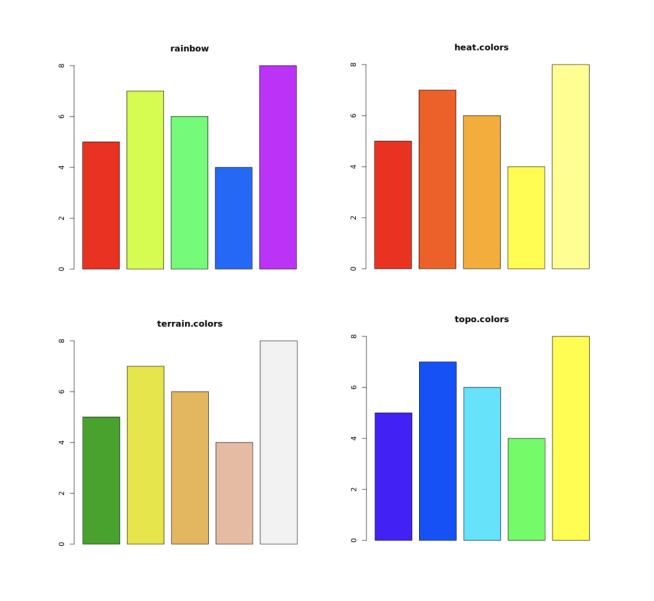
Color Palette
Here, we have used 4 built in color palettes which can be used to quickly generate color vectors of desired length.
- This blog post was originally published at:https://www.programiz.com/