Introduction
In this article, we will analyse a business problem with linear regression in a step by step manner and try to interpret the statistical terms at each step to understand its inner workings. Although the liner regression algorithm is simple, for proper analysis, one should interpret the statistical results.
First, we will take a look at simple linear regression and after extending the problem to multiple linear regression.
For easy understanding, follow the python notebook side by side.
What is Linear Regression?
Regression is the statistical approach to find the relationship between variables. Hence, the** Linear Regression** assumes a linear relationship between variables. Depending on the number of input variables, the regression problem classified into
-
Simple linear regression
-
Multiple linear regression
Business problem
In this article, we are using the Advertisement dataset.
Let’s consider there is a company and it has to improve the sales of the product. The company spends money on different advertising media such as TV, radio, and newspaper to increase the sales of its products. The company records the money spent on each advertising media (in thousands of dollars) and the number of units of product sold (in thousands of units).
Now we have to help the company to find out the most effective way to spend money on advertising media to improve sales for the next year with a less advertising budget.
Simple Linear Regression
Simple linear is an approach for predicting the quantitative response Y based on single predictor variable X.
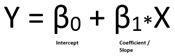
This is the equation of straight-line having slope β1 and intercept β0.
Let’s start the regression analysis for given advertisement data with simple linear regression. Initially, we will consider the simple linear regression model for the sales and money spent on TV advertising media.
Then the mathematical equation becomes 𝑆𝑎𝑙𝑒𝑠 = 𝛽0 + 𝛽1 * 𝑇𝑉.
Step 1: Estimating the coefficients: (Let’s find the coefficients)
Now to find the estimate of the sales for the advertising budget, we have to know the values of the β1 and β0. For the best estimate, the difference between predicted sales and the actual sales (called as residual) should be minimum.

As the residual may be negative or positive, so while calculating the net residual it can be lead to cancellation terms and reduction of net effect which leads to a non-optimal estimate of coefficients. To overcome this, we use a Residual sum of squares (RSS).
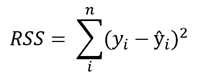
With a simple calculation, we can find the value of β0 and β1 for minimum RSS value.
With the stats model library in python, we can find out the coefficients,
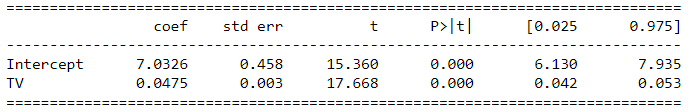
Table 1: Simple regression of sales on TV
Values for β0 and β1 are 7.03 and 0.047 respectively. Then the relation becomes, Sales = 7.03 + 0.047 * TV.
This means if we spend an additional 1000 dollars on TV advertising media it increases the sales of products by 47 units.
This gives us how strongly the TV advertising media associated with the sales.
Step 2: Assessing the Accuracy of the Coefficient Estimates ( How accurate these coefficients are? )
Why the coefficients are not perfect estimates?
The true relationship may not be perfectly linear, so there is an error that can be reduced by using a more complex model such as the polynomial regression model. These types of errors are called reducible errors.
On the other hand, errors may introduce because of errors in measurement and environmental conditions such as the office is closed for one week due to heavy rain which affects the sales. These types of errors are called**_ irreducible errors_**.
#linear-regression #machine-learning #basics #regression-analysis #data-science #data analysis