Yes, Chrome’s performance tab is overwhelming
First time you look into all the charts, you have no idea what means what. What do those different colors even mean? It’s not self-explanatory at all. There needs to be a guidebook.
In this article,
- I will briefly walk you through all functionalities of Chrome’s performance tab, with majority of the usual curiosities resolved.
- Using what we learned, we will find what made our React components so slow and think about how to improve them.
A very simple example with React
I wrote some short components, <Item /> and <LongList />, to make an example for our article.
import React, { useState } from 'react'

	const itemStyle = {
	  backgroundColor: 'grey',
	  width: '100%',
	  height: '20px',
	  marginBottom: '2px',
	}

	const Item = ({ number }) => {
	  return (
	    <article style={itemStyle}>
	      {number}
	    </article>
	  )
	}

	const longListStyle = {
	  backgroundColor: 'green',
	  marginTop: '1000px',
	  padding: '5px',
	}

	const buttonStyle = {
	  position: 'fixed',
	  top: 50,
	  right: 50,
	  width: '100px',
	  height: '100px',
	}

	function generateRandomString(length, chars) {
	  let result = '';
	  for (let i = length; i > 0; --i) result += chars[Math.floor(Math.random() * chars.length)];
	  return result;
	}

	function generateManyRandomThings() {
	  return Array.from(
	    Array(4500),
	    function generateRandomThing() {
	      return Math.random() > 0.5 ?
	      generateRandomString(32, '0123456789abcdefghijklmnopqrstuvwxyzABCDEFGHIJKLMNOPQRSTUVWXYZ') :
	      Math.random() * 100000
	    }
	  );
	}

	export const LongList = () => {
	  const [clickCount, setClickCount] = useState(0);
	  const [randomThings, setRandomThings] = useState(() => generateManyRandomThings());
	  const handleClick = () => {
	    setClickCount(clickCount + 1);
	    setRandomThings(generateManyRandomThings());
	  }

	  return (
	    <div>
	      <button style={buttonStyle} onClick={handleClick}>{`reload (clickCount: ${clickCount})`}</button>
	      <section style={longListStyle}>
	        {randomThings.map((num, idx) => (
	          <Item key={`item-${idx}`} number={num}/>
	          ))}
	      </section>
	    </div>
	  )
	}
view raw
block1.js hosted with ❤ by GitHub
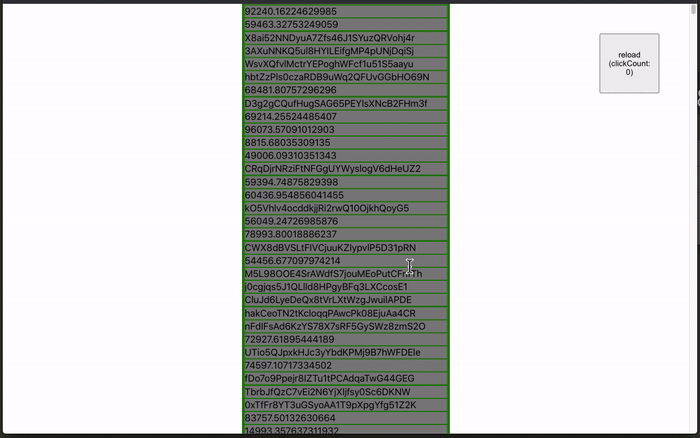
And it’s showing me this, which is full of 4500 rows of <Item /> s and a button to make all 4500 rows again:
The entire loading is quite slow if you slow down CPU on Chrome, like this:
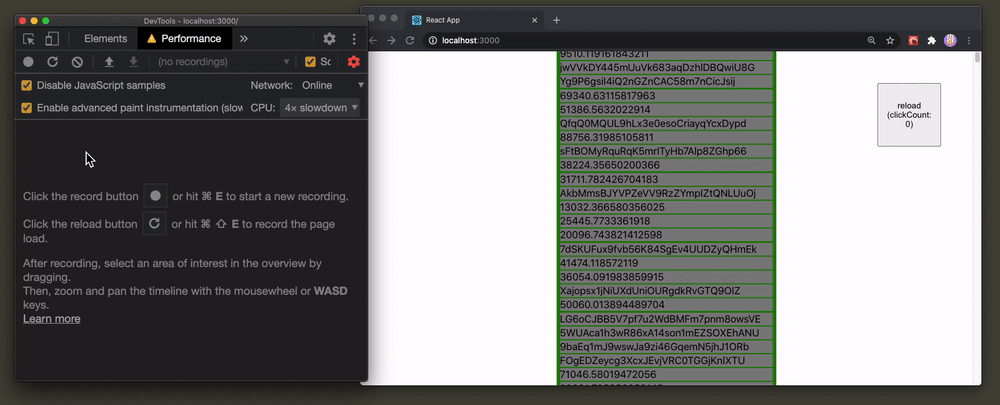
This means that on lower-end PCs, it’s likely that it’s going to be slow like that too. Let’s guess for a second. What’s making this so slow? Network requests? generateManyRandomThings because it’s producing so many elements in an array? Save your guess for now. We are going to investigate this thorougly as we are reaching the end of this guide.
You are able to see the entire source code on Github (Chrome Performance profiles included) and access the deployed website on netlify. Feel free to open up performance devtools on Chrome and try on your own (the production deployment might behave differently, though)
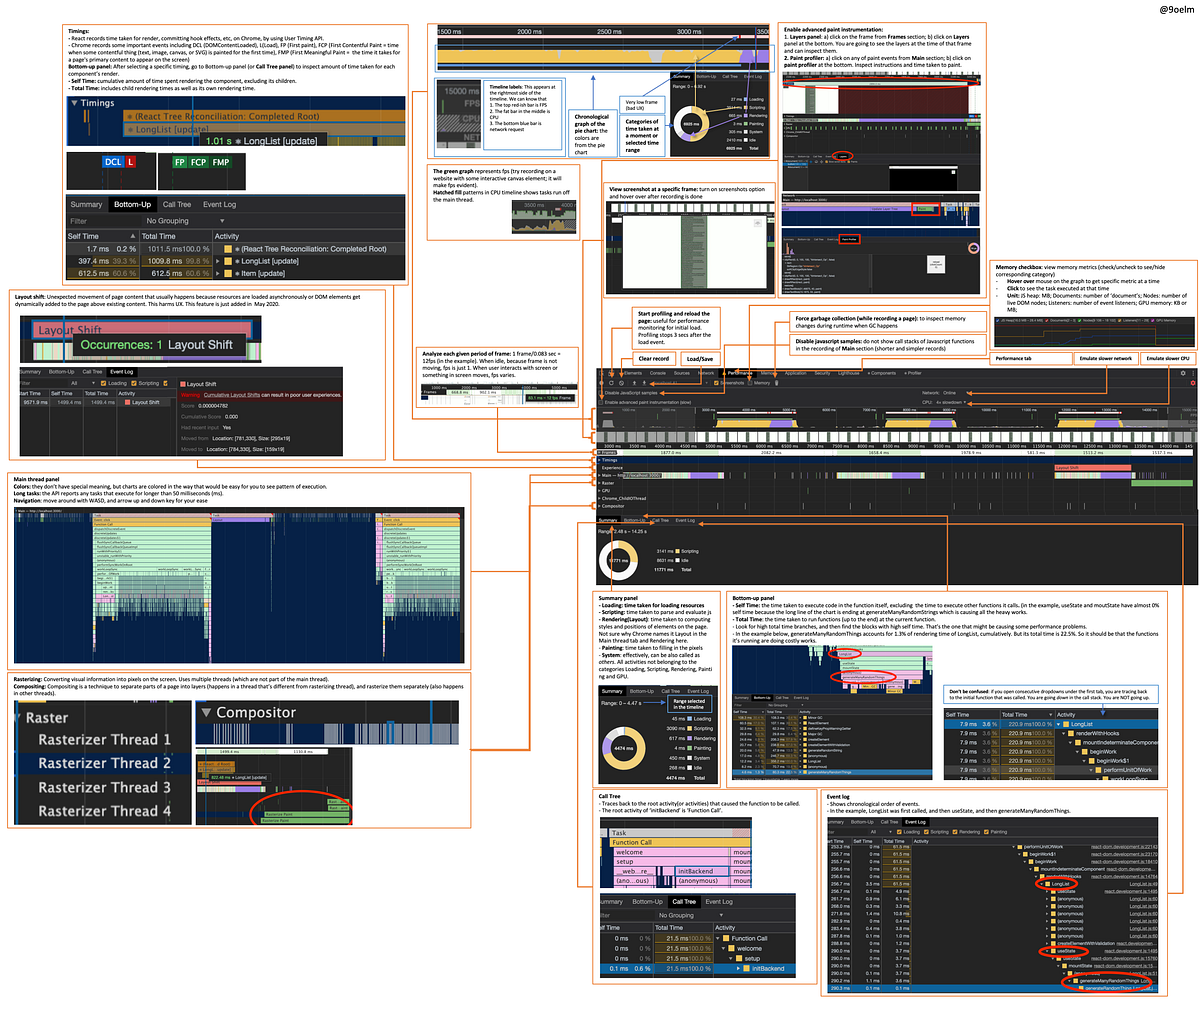
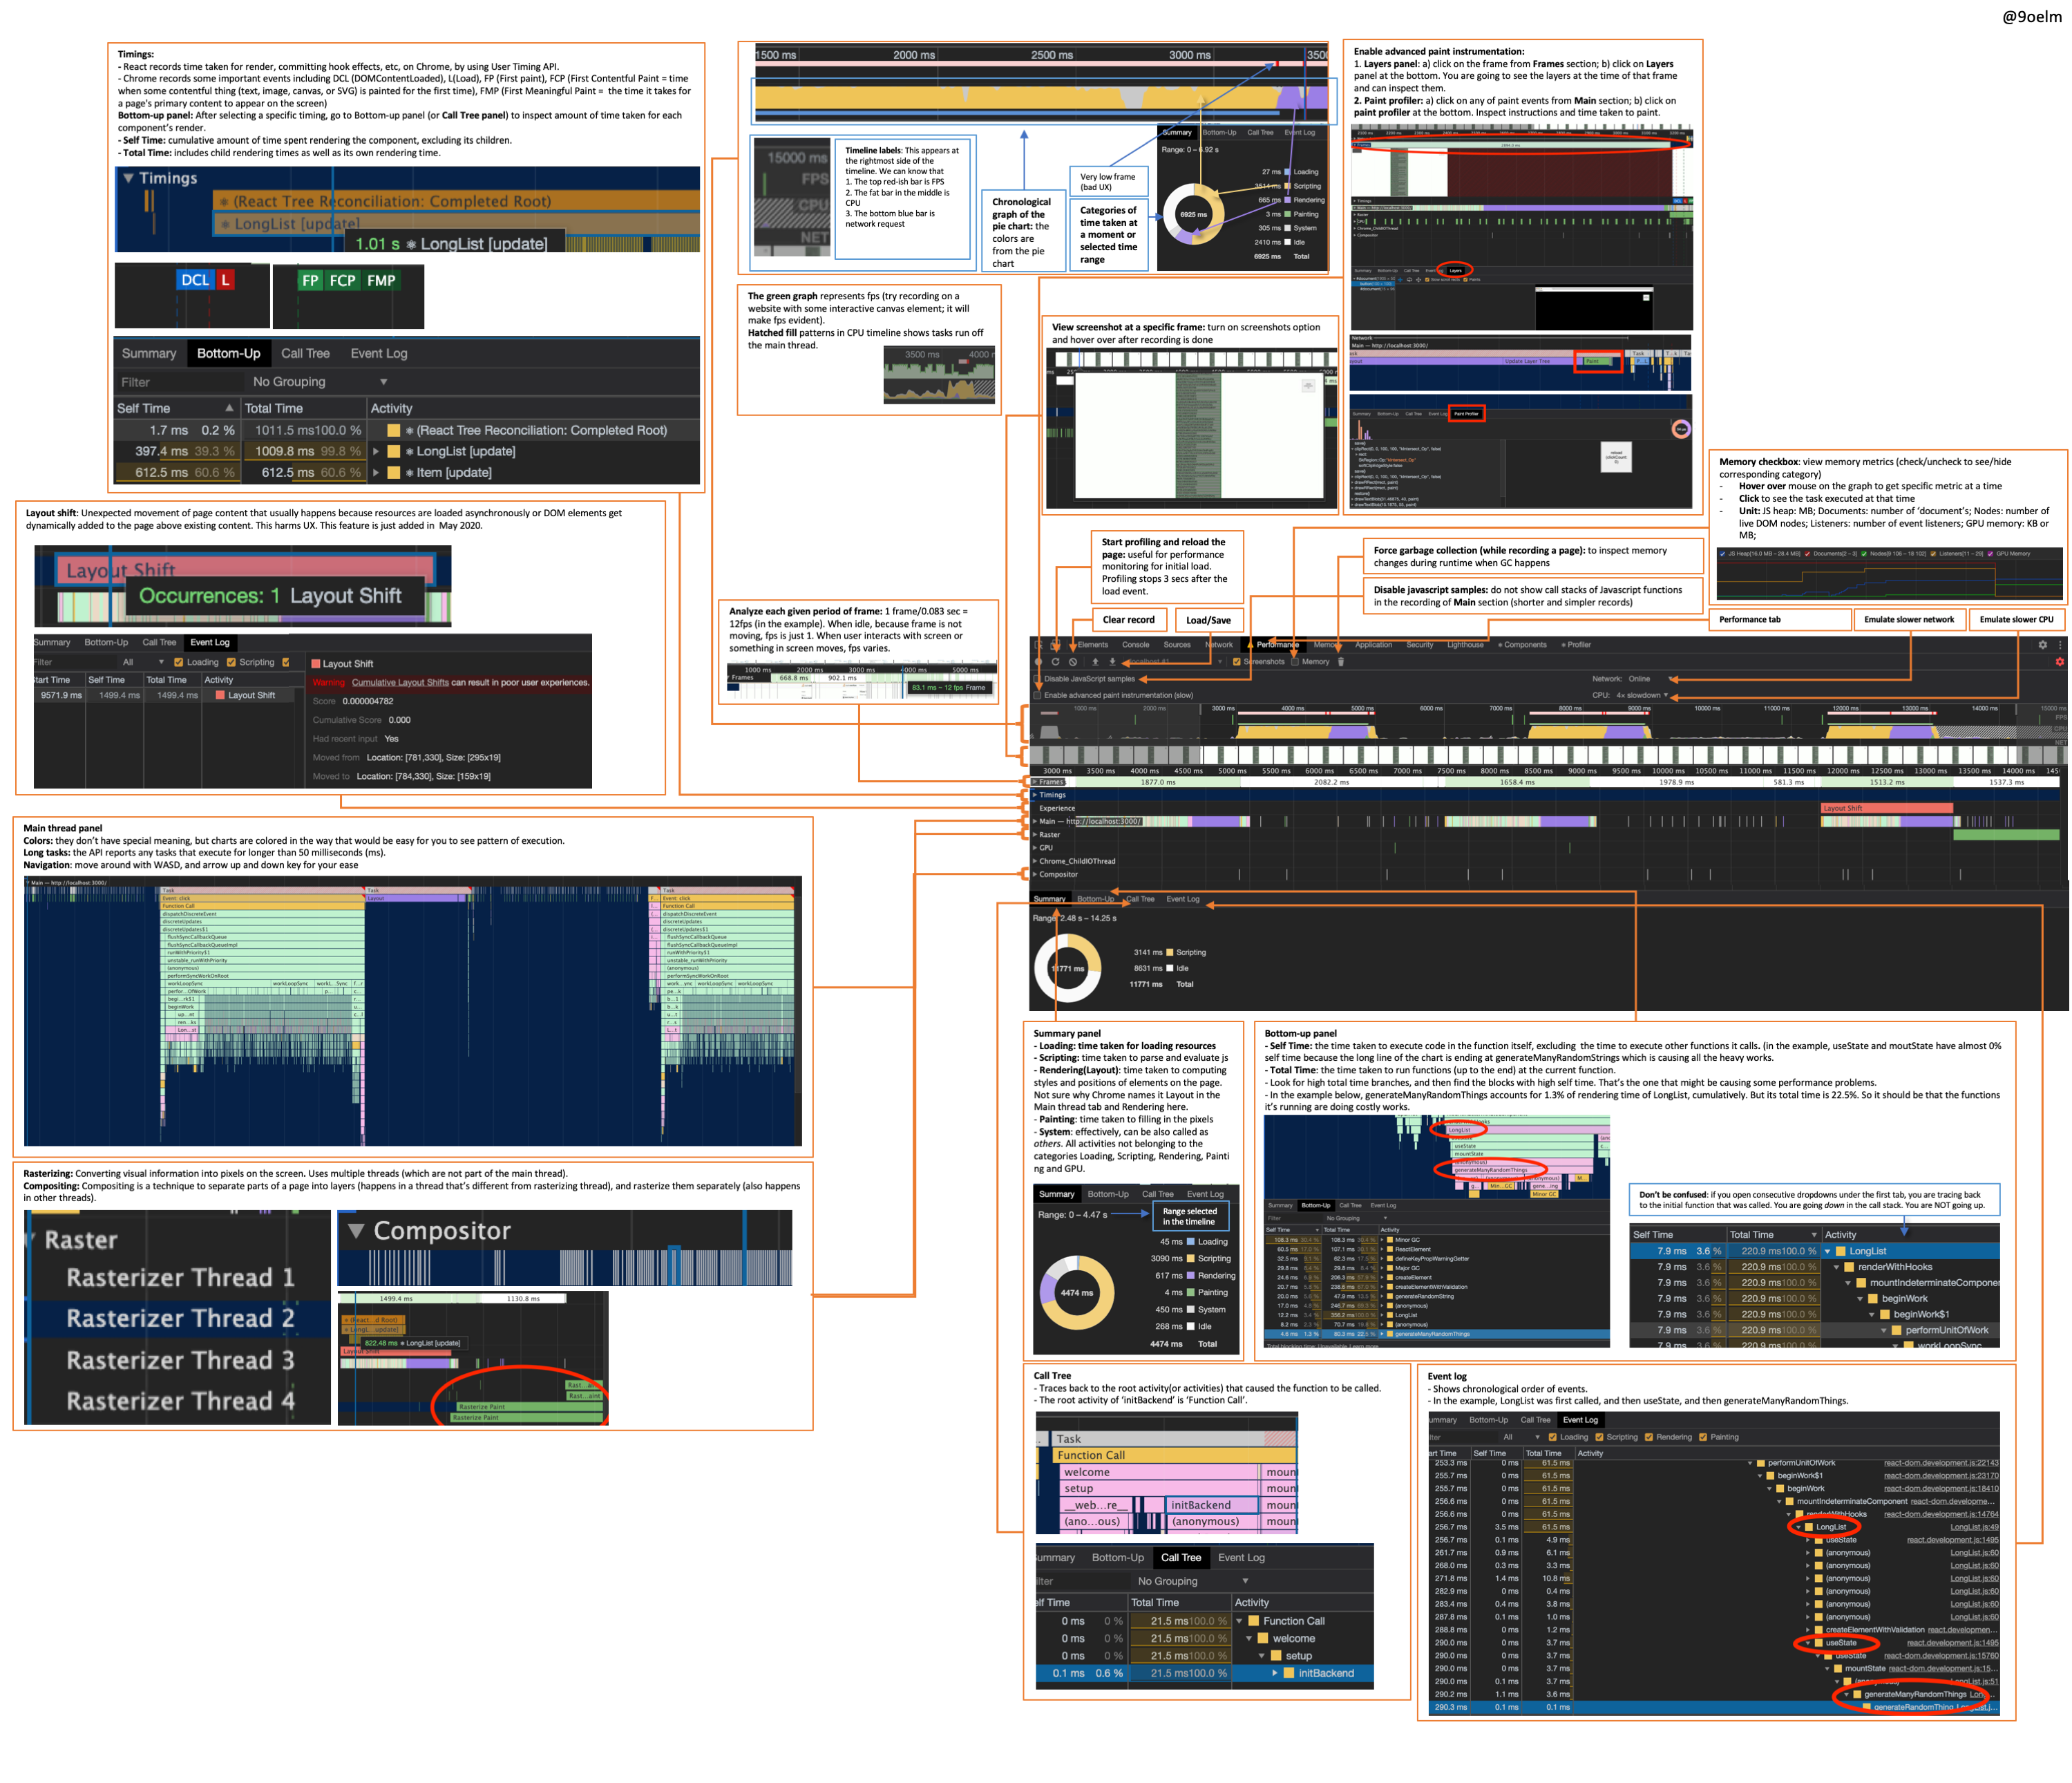
An overview of all major functionalities in a single slide
So here’s what those colors and jargons mean. Check this image out. I wanted to have it in a single slide so that I could grasp everything at one go (the resolution of the image below is poor, please open here for a good resolution).
Breaking down the overwhelming parts
I will explain each part that seems to be overwhelming or not self-explanatory, one by one.
Reload button

Clicking on the reload button will reload the page and start profiling automatically, and profiling will stop 3 seconds after the load event. This is useful for performance monitoring for initial load.
#programming #react #optimization #chrome #javascript