In this article, we will be using the image of the polymer structure to predict its glass transition temperature. This article follows a similar methodology as published in one of the recent research papers by Luis.A. Miccio from Materials Physics Center and Donostia International Physics Center in Spain.

Introduction:
Glass Transition temperature is one of the crucial properties of polymers. It marks the temperature range below which the atoms of a supercooled liquid are temporarily frozen (without crystallizing) upon cooling. Predicting glass transition temperature (Tg) provides valuable insights into polymer properties whose synthesis may otherwise be costly and time-consuming. Scientists have always been more keener to develop machine learning models qualitatively(For instance, using several other properties to predict its tensile strength). During the last few years, the major emphasis has been given to Quantitative Structure-Property Relationships. This opens the possibility of predicting various properties with just the Structure of the molecular (i.e just the image) compound avoiding requirement of any additional experimental properties or tedious calculations. In this article, we will be using Convolutional Neural Networks to predict Tg of unknow polymer compounds, using the image of the polymer. This sounds so cool, this literally means that if you just draw the image of the monomeric unit on a whiteboard that would be enough to predict its Tg. We do not need any other external information or properties for the polymer.
Importing Relevant Packages
Dataset
The dataset used in our study was gathered from a popular polymer database. The dataset for this study comprises of 351 polymers along with their smiles codes, molecular names as input attributes and glass transition temperatures as the output variable. Subsets of 300 polymers and their Tg values were used for training validating the dataset, whereas the rest 51 unseen polymers were used to test the results for both the models, the CNN and the proposed ANN. The figure below shows the top 5 rows of the dataset. The dataset for this study can be found here.
Reading and Cleaning the Dataset

Top 5 rows of the Data Frame
Classifying Polymers
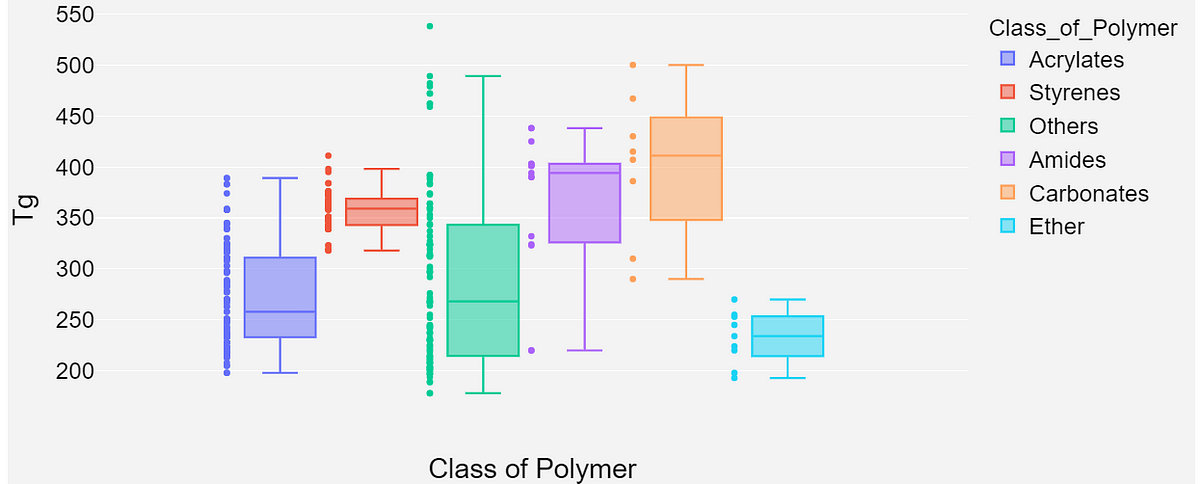
The dataset was manually explored using the Pandas library in python and was classified into eight different classes of polymers- acrylates, styrenes, amides, alkenes, ether, amides, carbonates, and others.

Exploratory Data Analysis
**Pie Plot: **The pie plot in Figure shows the exact composition of the dataset, with acrylates and styrenes being the highest contributors

**Box Plot: **The box plot is used to show the scatter plot of the underlying Tg distributions for each class of polymers. It can be seen that styrenes tend to have higher Tg whereas acrylates have a fairly mixed distribution.
#data-science #deep-learning #materials #chemistry #machine-learning #deep learning