How R Still Excels Compared To Python
While Python and R used to be the two main go-to languages for data science, the former had been eclipsing the latter for some time. However, R appears to be making a strong comeback.
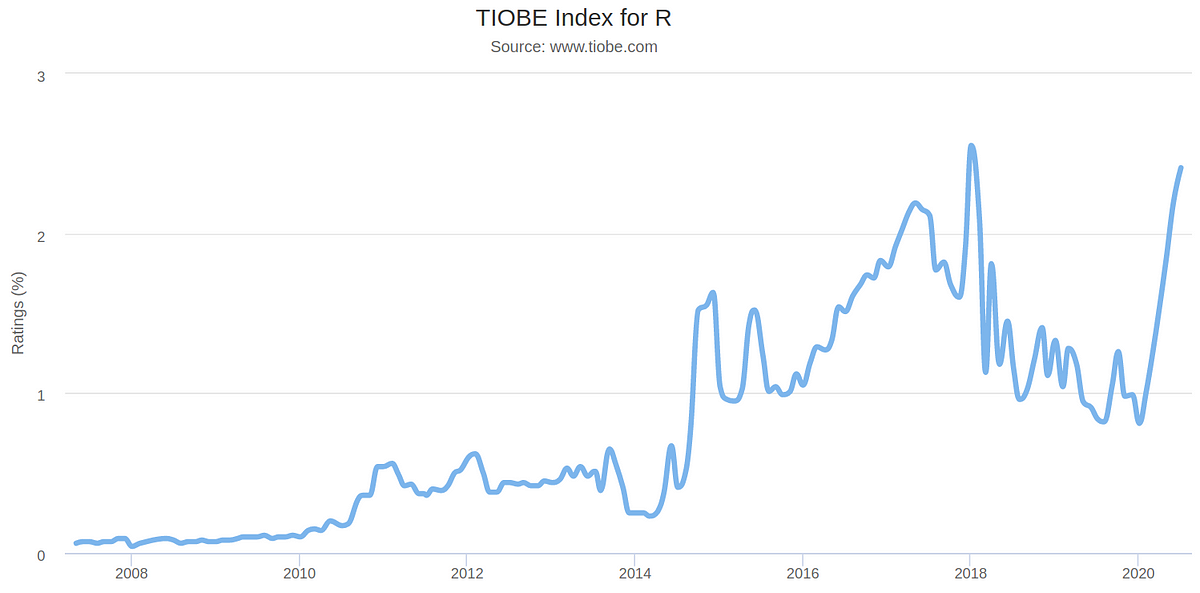
When looking at the TIOBE index for R, we can see that after a peak in ratings in January 2018, the language saw a significant decline after that point. However, it is evident that ratings have been shooting back up since March.
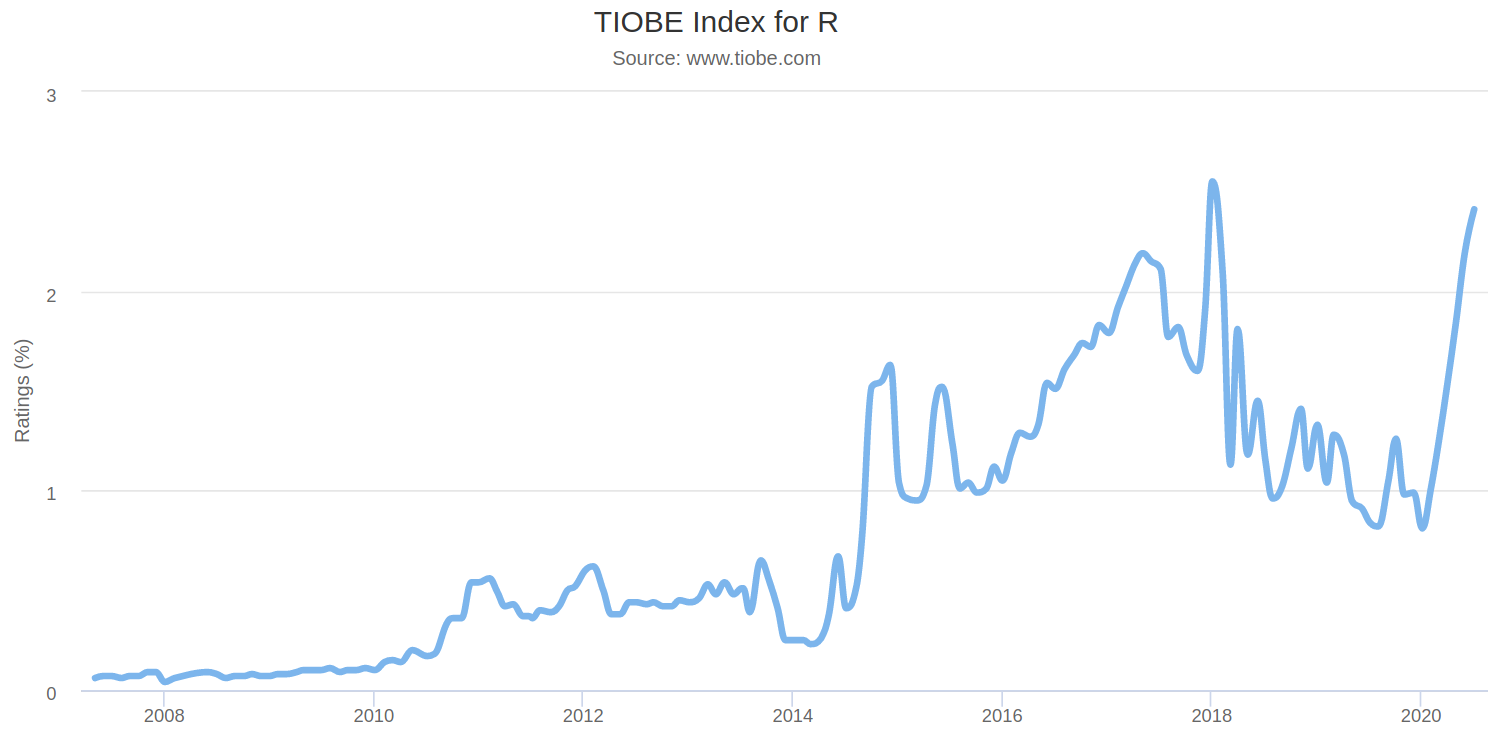
Source: www.tiobe.com
What is the reason for this?
Well, one of the big reasons is that COVID-19 has sparked a strong rebound in an interest for statistics.
Up till now, the field of data science had been eschewing this area in favour of more “sexy” topics such as natural language processing, computer vision, among others.
However, the ongoing pandemic has reignited the debate surrounding the role statistical analysis has to play in analysing and ultimately combatting this virus.
Given the nature of comparing statistics between different countries, there has been a particular interest in logarithmic charts, and their use when it comes to comparing data with vastly different scales, as the below tweet illustrates:
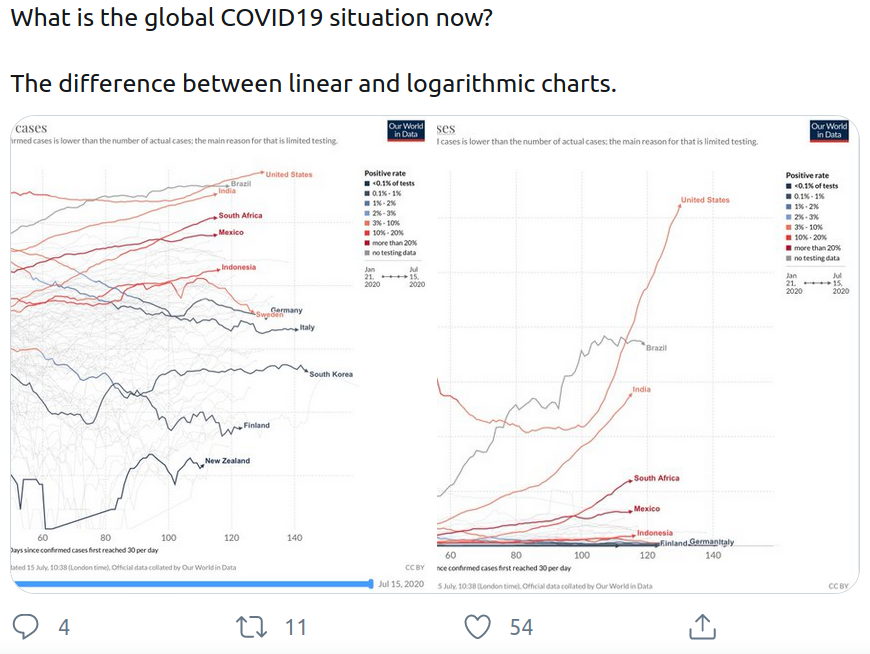
Source: twitter.com
It therefore stands to reason that if one wants to conduct effective statistical analysis quickly, one would seek an intuitive statistical environment to run the numbers. The evidence suggests that R is still dominating here.
However, in my experience of using both Python and R, here are my experiences of how the latter is still superior to the former.
1. R can still outperform Python when analysing time series data
If you have worked with time series analysis before, you are most likely familiar with what is called the ARIMA (Autoregressive Integrated Moving Average) model.
This is a model that can be used to make forecasts based on the structure of a time series. An ARIMA model consists of coordinates (p, d, q):
- p stands for the number of autoregressive terms, i.e. the number of observations from past time values used to forecast future values. e.g. if the value of p is 2, then this means that two previous time observations in the series are being used to forecast the future trend.
- d denotes the number of differences needed to make the time series stationary (i.e. one with a constant mean, variance, and autocorrelation). For instance, if d = 1, then it means that a first-difference of the series must be obtained to transform it into a stationary one.
- q represents the moving average of the previous forecast errors in our model, or the lagged values of the error term. As an example, if q has a value of 1, then this means that we have one lagged value of the error term in the model.
#statistics #r-programming #rstats #data-science #regression