In my previous blog, we learnt about Covariance to measure relationship between two random variables.
Covariance
In this blog, we’ll try to understand how to measure relationships between random variables.
As Covariance has limitation to quantify the relationship, there is another concept called Pearson correlation coefficient (PCC) that overcome this limitation. It’s often represented with the Greek alphabet ρ. So the Pearson correlation coefficient between two random variables x and y is nothing but the covariance( X, Y) divided by the standard deviation of x and the standard deviation of y. Here is the mathematical formula for ρ.
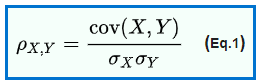
Now, you might ask, why are we defining a new metric? Because covariance doesn’t take variability in account, and here we use the standard deviation of x and y in denominator.
What exactly standard deviation of x is? It is nothing but square root of variance of x, and variance is all about variability.
When you measure covariance, you’re not measuring the variability within x&y. But just a small modification on covariance i.e (dividing your covariance by a standard deviation of x and standard deviation of y) will give you variability and interpretability.
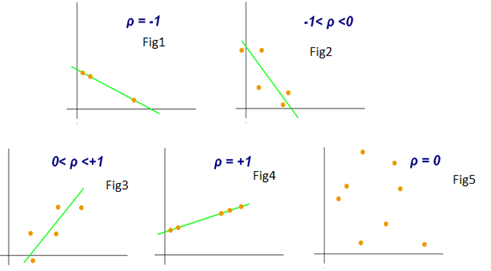
As we saw in last blog on Covariance i.e, as x increases, if y also increase, then covariance is going to be positive. But how much positive? It could be very, very positive or very negative, right? Similarly, I know that as x increases, y decreases, my covariance is going to be negative. Right? But I don’t know how much negative…
So PCC is a very nice idea to quantify the relationship, Below graph gives a better understanding on PCC.
#statistical-analysis #statistics #pearson-correlation #variability #covariance #data analysis