In this article, I will show you a time series forecasting method I haven’t seen documented elsewhere. I doubt it is a new method, but since I haven’t seen a great article on it, here it is.
The Dataset
The data I used for this project is the data from the Global Energy Forecasting competition, put on by my hometown university, UNC Charlotte. You can find more about it here: http://www.drhongtao.com/gefcom/2017
What you need to know is the data is various readings from an energy grid. Our target is to forecast real-time energy demand for the grid using these data points. The data points also include dew point and dry bulb temperature, since air conditioning is a huge driver of energy consumption.
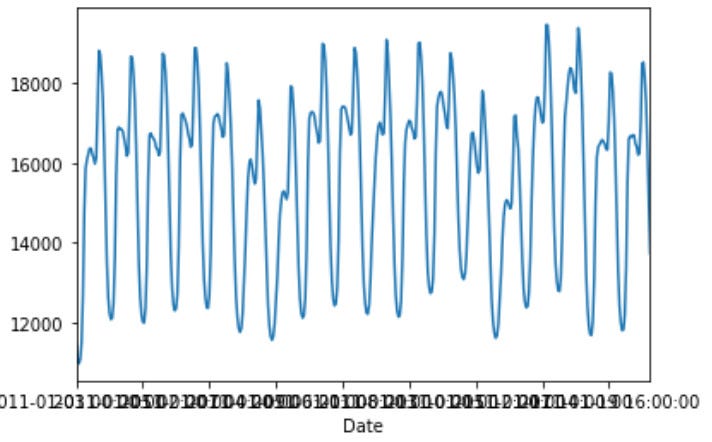
Our target variable is RTDemand: Real Time energy demand for the energy grid we are working with. The data has clear daily cycles. Here are three days of our data:
Hourly for 3 days
In the middle of the night when the sun is down and everyone is asleep, our power consumption reaches a minimum. We wake up in the morning, head off to work, and our power consumption reaches its maximum as the sun reaches peak intensity. I think the daily dips correspond to commuting times.
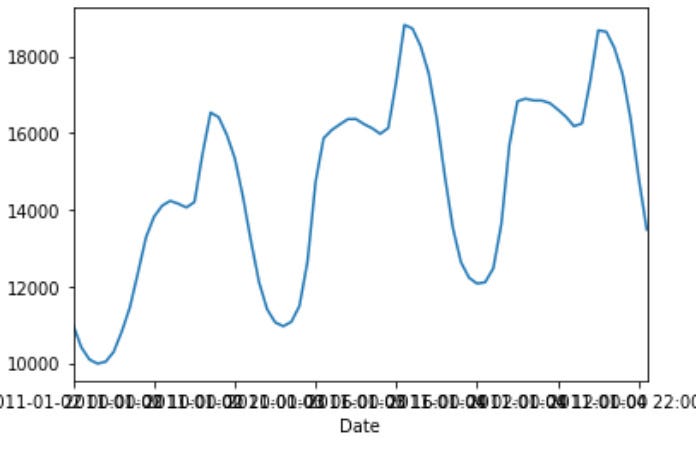
If we zoom out a little more, we can see clear auto-correlation and trends in days, just as you see in weather. Here’s about 3 weeks of data:
3 Weeks of the target variable
#energy #machine-learning #python #convolutional-network #time-series-analysis