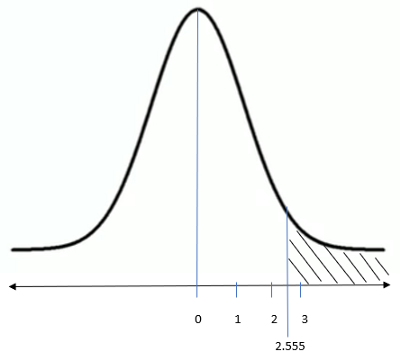
A hypothesis test is a statistical method to test the validity of a commonly accepted claim about a population. That commonly accepted claim is called a null hypothesis. Based on the p-value, we reject or fail to reject a null hypothesis.
Key Characteristic To Remember
The smaller the p-value, the stronger the evidence that the null hypothesis should be rejected.
The test statistic follows a normal distribution when the sample size is large enough. When at least 10 positives and at least 10 negative answers are in the sample, the sample size can be called large enough. Please see the example below for a more clear explanation.
Understanding The Hypothesis Test With An Example
Here is the research question:
‘In previous year 52% of parents believe that electronics and social media was the cause of their teenager’s lack of sleep. Do more parents today believe that their teenager’s lack of sleep is caused due to electronics and social media?’
This question is taken from the course ‘Inferential Statistical Analysis with Python’ in Coursera. In this question, we are asked to test, if there is a significant increase in the number of parents who believe that social media is the cause of their teenager’s lack of sleep. Here is the step by step process of performing this test:
Step 1:
Set up the null hypothesis. In any hypothesis test, we need to set up the hypothesis before collecting any data. Researchers set up two hypotheses. The first one is the null hypothesis which is the belief or premise that researchers want to test and reject. In the example above, the null hypothesis is 0.52. Because 52% of parents believe that electronics and social media were causing their teenager’s lack of sleep.
Image for post
Step 2:
Define the alternative hypothesis. Look at the research question again. We need to find out if more parents today believe that electronics and social media are the cause of the lack of sleep. That means, we have to find out if p is greater than 0.52 today.
Image for post
After conducting the p-test, if we have enough evidence to reject the null hypothesis, we will accept the alternative hypothesis.
Step 3:
Choose the significance level. Most of the time researchers choose 0.05. That means the confidence level is 95%. A p-value with a significance level of less than or equal to 5% means that there is a probability of greater than or equal to 95% that the results are not random. So, your results are significant and there is enough evidence to reject the null hypothesis. For this example, we will use the significance level 0.05.
Image for post
Step 4:
Collect the data. After defining the hypothesis and significance level, we should collect the data. For this example, Mott’s Children’s Hospital collected the data and found out this:
‘A random sample of 1018 parents with a teenager was taken. 56% of them said that they believe electronics and social media was the cause of their teenager’s lack of sleep.’
Image for post
Step 5:
Check the standard assumptions for the hypothesis test. There are two assumptions:
We need a simple random sample.
We need a large enough sample size to ensure the distribution of sample proportions are normal.
How to know if the sample is large enough? n* p needs to be at least 10 and n*(1-p) also needs to be at least 10. Here, p is 0.52. Because 0.52 is our null hypothesis. And n is the population size. In this case 1018.
#data-science #data-analysis #hypothesis-testing #towards-data-science #statistics #data analysis
