A quick and ready script to extract repetitive tables from PDF
This tutorial is an improvement of my previous post, where I extracted multiple tables without Python pandas. In this tutorial, I will use the same PDF file, as that used in my previous post, with the difference that I manipulate the extracted tables with Python pandas.
The code of this tutorial can be downloaded from my Github repository.
Almost all the pages of the analysed PDF file have the following structure:
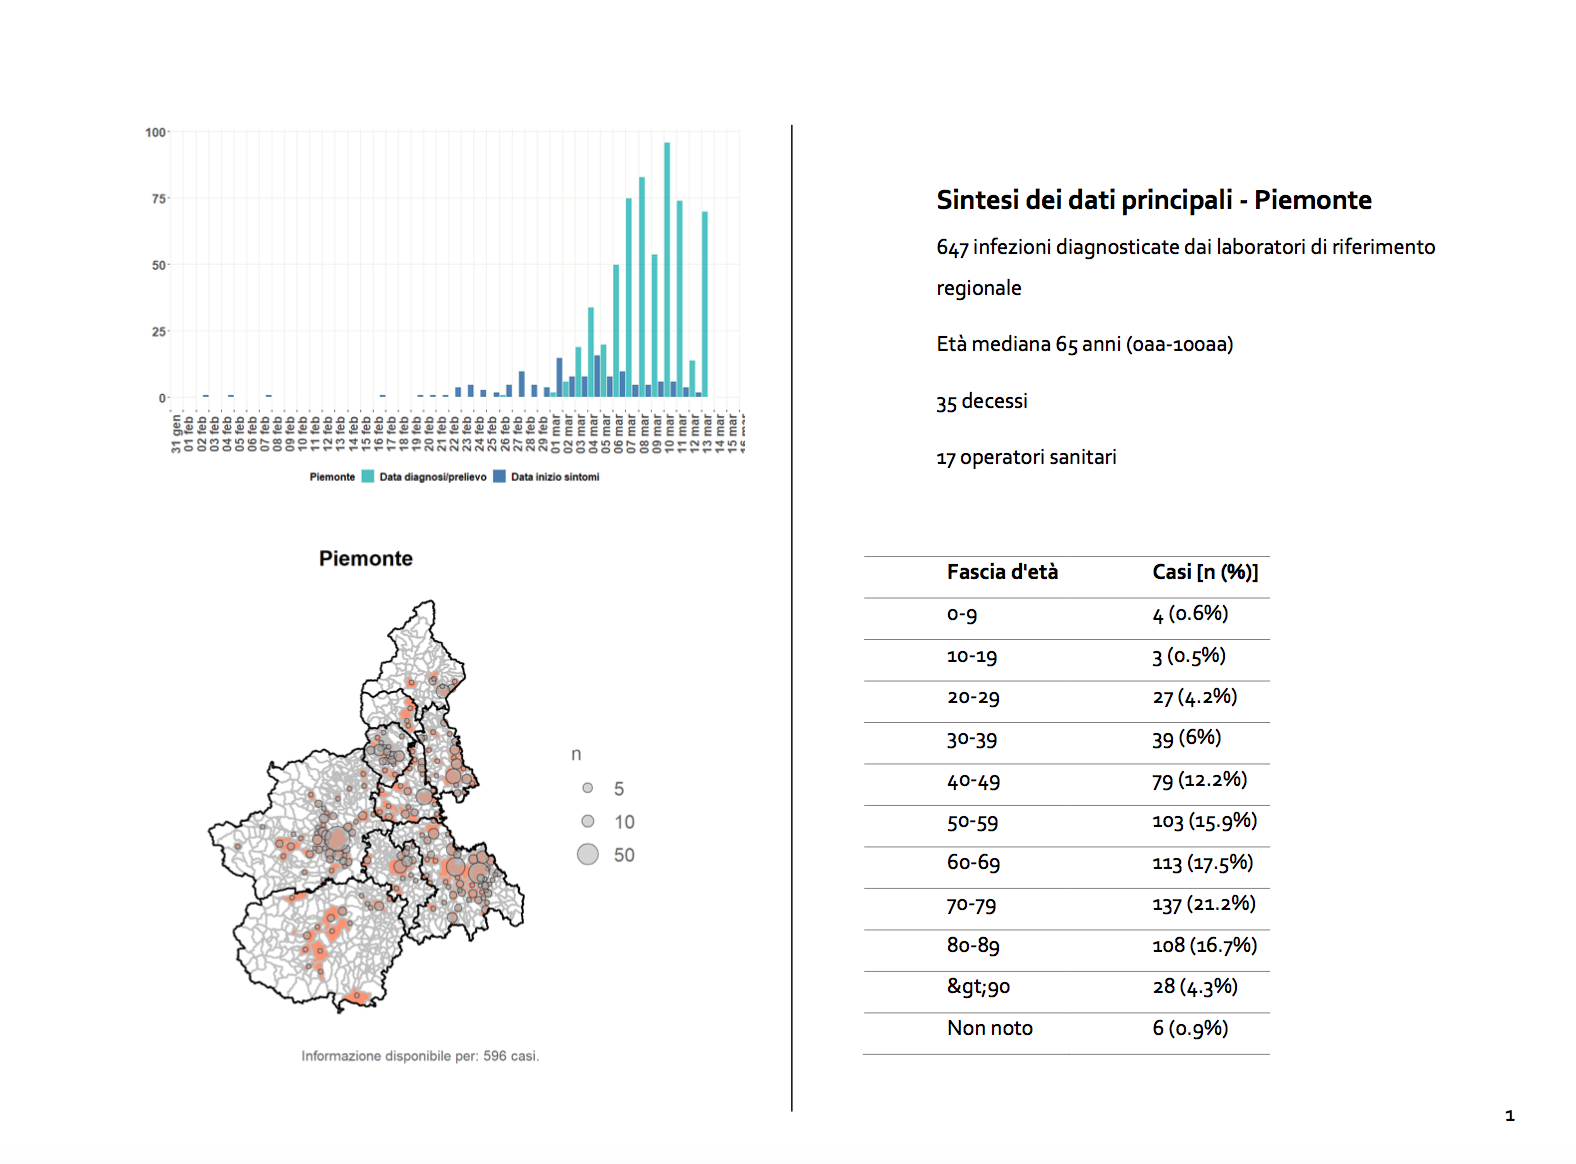
Image by Author
In the top-right part of the page, there is the name of the Italian region, while in the bottom-right part of the page there is a table.
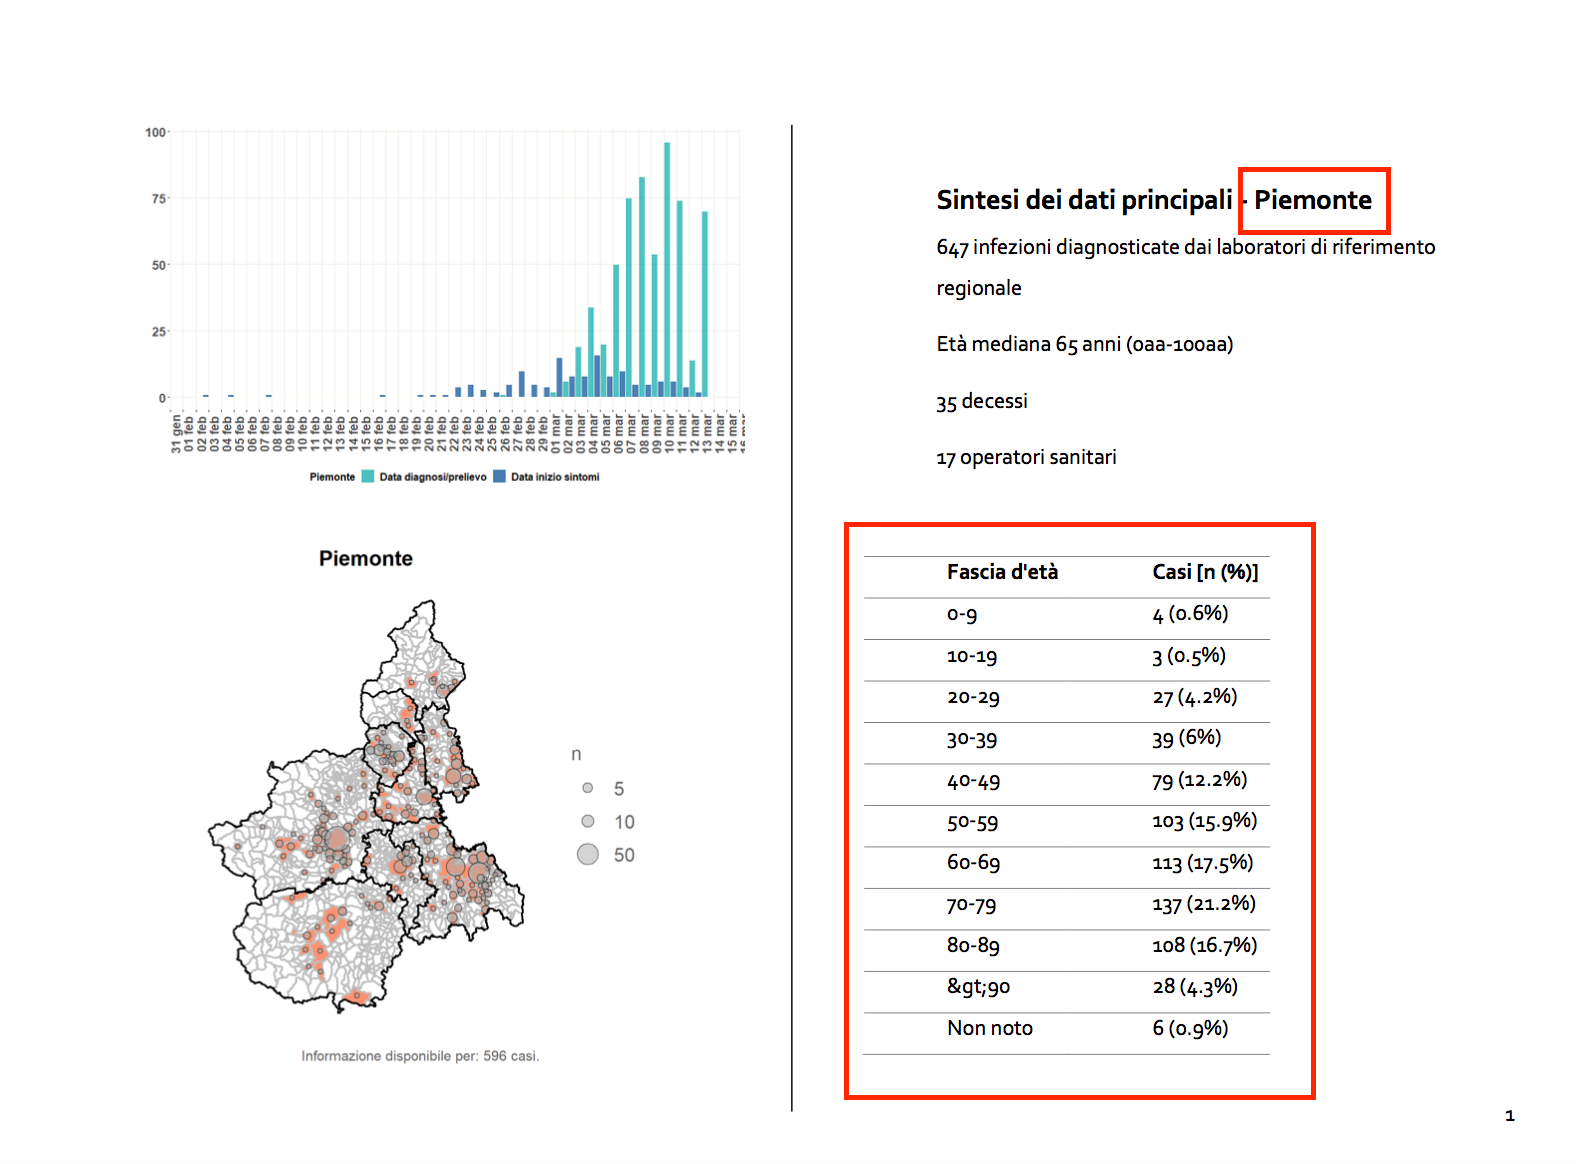
Image by Author
I want to extract both the region names and the tables for all the pages. I need to extract the bounding box for both the tables. The full procedure to measure margins is illustrated in my previous post, section Define margins.
This script implements the following steps:
- define the bounding box, which is represented through a list with the following shape:
[top,left,bottom,width]. Data within the bounding box are expressed in cm. They must be converted to PDF points, sincetabula-pyrequires them in this format. We set the conversion factorfc = 28.28. - extract data using the
read_pdf()function - save data to a
pandasdataframe.
In this example, we scan the pdf twice: firstly to extract the regions names, secondly, to extract tables. Thus we need to define two bounding boxes.
#data-collection #tabula-py #data-science #pdf-extraction #python #how to extract tables from pdf using python pandas and tabula-py