Bar Graphs with Animation using JavaScript, HTML, & CSS
Now this time to create a bar graph. Chart or Graphs are mostly used in backend site or admin panel, sometimes we have to show data to users then we use it on frontend also. Basically, the chart is an important part of web development.
Today you will learn to create a Bar Chart using jQuery. jQuery is JavaScript library, that’s why I am calling this a JS program. Basically, Libraries are created for easy to do works. You can use this bar graph anywhere as you want, this is a very simple and easy program. You just have to create a new div like other bars and have to put percentage values.
So, Today I am sharing JavaScript Animated Bar Graph, A jQuery Bar Chart With Animation. This program is very short but useful, you can create this easily after understanding the codes. You can place it anywhere as your requirement. It has a very pretty and flat UI, you can reskin easily.
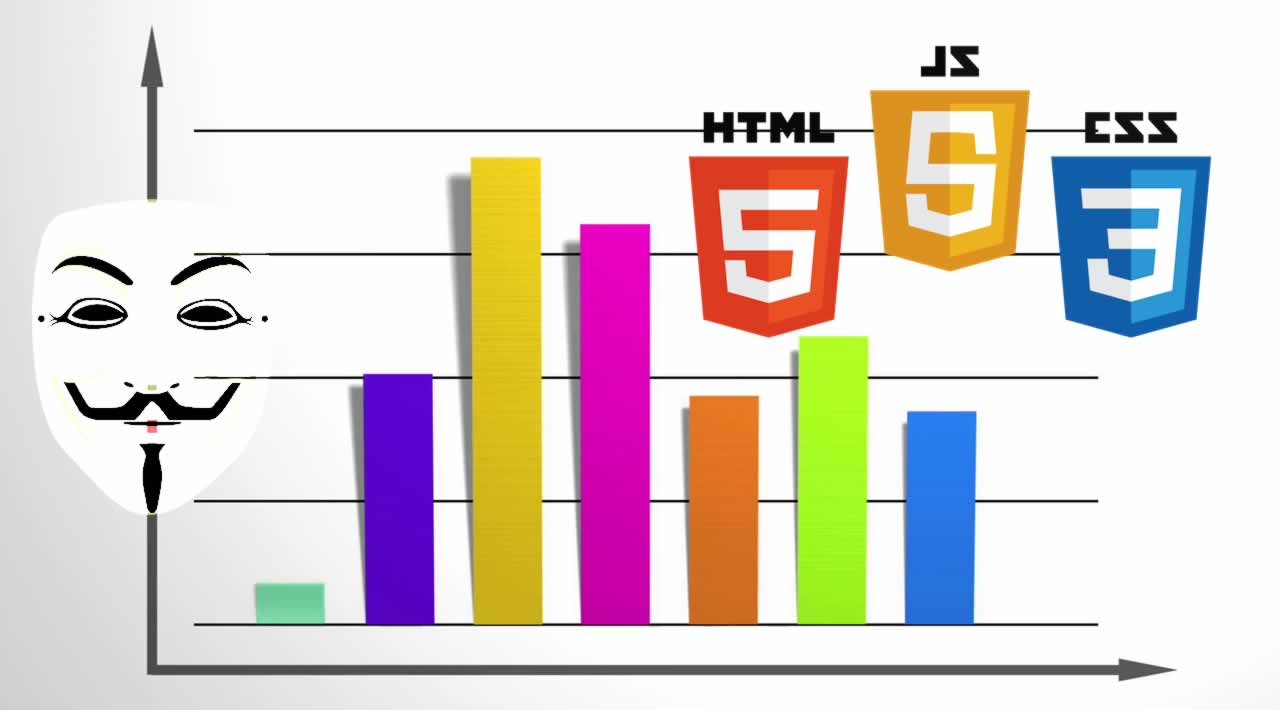
If you are thinking now how this JavaScript Bar Graph actually is, then see the preview given below.
Preview Of Bar Chart With Animation
See this video preview to getting an idea of how this chart looks like.
Now you can see this visually. If you like this, then get the source code of its.
JavaScript Animated Bar Graph Source Code
Before sharing source code, let’s talk about it. I have created a separated div for each bar, and a span for showing percentage. Used HTML Data-*attribute to store custom values as percentage values. Finally stored percentage values like this : data-percent="75%" , you have just change these values to make changes.
Now the full HTML with bar, percentage, label look like this: <div class="bar" data-percent="80%"><span class="label"> Name </span></div> In the CSS file I have manged all the position, colors, font, etc. I have used a google font to creating this program. Now the jQuery or JavaScriptfetched the data-percent attribute, now jquery push the backgound acording to given percentage values.
The background fills with 2sec delay, that creates the animation effect. As you can see in the preview one bar has a dark color & other has a lightcolor. For creating this I have used CSS :nth-of-type(odd) property.
There are a lot of basic commands, I can’t explain all in writing. You will understand this easily after getting the codes. For creating this program. you have to create 3 files, first for HTML, second for CSS, and third for JavaScript. Follow the steps to creating this without any error.
index.html
Create an HTML file named ‘index.html‘ and put these codes given here below.
<!DOCTYPE html>
<!-- Code By Webdevtrick ( https://webdevtrick.com )-->
<html lang="en" >
<head>
  <meta charset="UTF-8">
  <title>JavaScript Animated Bar Graphs | Webdevtrick.com</title>
  <link href="https://fonts.googleapis.com/css?family=Electrolize&display=swap" rel="stylesheet">
  <link rel="stylesheet" href="style.css">
</head>

<body>
   <div class="wrap">
<h1>JavaScript Animated Bar Graphs</h1>
<div class="holder"><div class="bar " data-percent="95%"><span class="label">HTML</span></div>
<div class="bar" data-percent="80%"><span class="label second">CSS</span></div>
<div class="bar" data-percent="65%"><span class="label">JavaScript</span></div>
<div class="bar" data-percent="75%"><span class="label second">jQuery</span></div>
<div class="bar" data-percent="90%"><span class="label">Bootstrap</span></div>
<div class="bar" data-percent="40%"><span class="label second">React</span></div>
<div class="bar" data-percent="45%"><span class="label ">Vue</span></div>
<div class="bar" data-percent="50%"><span class="label second">Angular</span></div>
<div class="bar" data-percent="95%"><span class="label">CMS</span></div>
<div class="bar" data-percent="70%"><span class="label second">Node JS</span></div>
  </div>

  <script src='http://cdnjs.cloudflare.com/ajax/libs/jquery/2.1.3/jquery.min.js'></script>
<script  src="function.js"></script>

</body>
</html>
style.css
Now create a CSS file named ‘style.css‘ and put these codes given here.
/** Code By Webdevtrick ( https://webdevtrick.com ) **/
* {
  margin: 0;
  padding: 0;
  border: 0;
  font: inherit;
  font-size: 100%;
  vertical-align: baseline;
  font-family: 'Electrolize', sans-serif;
}
body {
  color: #212121;
  -webkit-font-smoothing: antialiased;
  padding: 2%;
  line-height: 1;
}
h1 {
  font-weight: bold;
  text-align: center;
  font-size: 1.5em;
  padding: .5em 0;
  margin-bottom: 1em;
  border-bottom: 2px solid #212121;
  letter-spacing: 3px;
  text-transform: uppercase;
}
.wrap {
  width: 50%;
  margin: 0 auto;
}
.bar {
  background: #ff413d;
  width: 0;
  margin: .25em 0;
  color: #fff;
  position: relative;
  transition: width 2s, background .2s;
  -webkit-transform: translate3d(0, 0, 0);
  clear: both;
}
.bar:nth-of-type(odd) {
  background: #ff6461;
}
.bar .label {
  font-size: .75em;
  padding: 1em;
  background: #212121;
  width: 7em;
  display: inline-block;
  position: relative;
  z-index: 2;
  font-weight: bold;
}
.bar .label.second {
  background: #333;
}
.count {
  position: absolute;
  right: .25em;
  top: .75em;
  padding: .15em;
  font-size: .75em;
  font-weight: bold;
}
function.js
The final step, create a JS file for jQuery named ‘function.js‘ and put the codes.
/** Code By Webdevtrick ( https://webdevtrick.com ) **/
setTimeout(function start (){

  $('.bar').each(function(i){
    var $bar = $(this);
    $(this).append('<span class="count"></span>')
    setTimeout(function(){
      $bar.css('width', $bar.attr('data-percent'));
    }, i*100);
  });

$('.count').each(function () {
    $(this).prop('Counter',0).animate({
        Counter: $(this).parent('.bar').attr('data-percent')
    }, {
        duration: 2000,
        easing: 'swing',
        step: function (now) {
            $(this).text(Math.ceil(now) +'%');
        }
    });
});

}, 500)
That’s It. Now you have successfully created the JavaScript Animated Bar Graph, Bar Chart With Animation. If you liked this post, share it with all of your programming buddies! Thank you!
Originally published on https://webdevtrick.com
#javascript #html #css #jquery #graphql