A project on multivariate analysis
One way to predict home prices is to become an ascended spiritual master who is able to see all timelines and dimensions, astral travel to the exact time and space of the sale of the home, and see exactly how much it closed for.
Another way is through data.
The Data
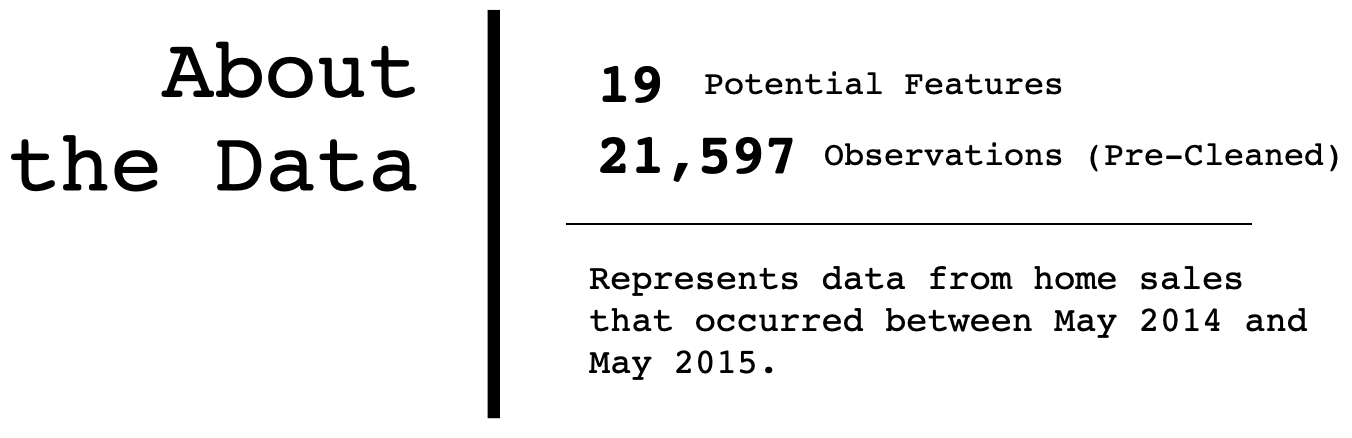
The data for this project came directly from King County Washington and included features such as:
- Latitude/Longitude
- Year Renovated
- Waterfront (Yes/No)
- Number of bedrooms/bathrooms
- Condition (Home grade given by King County)
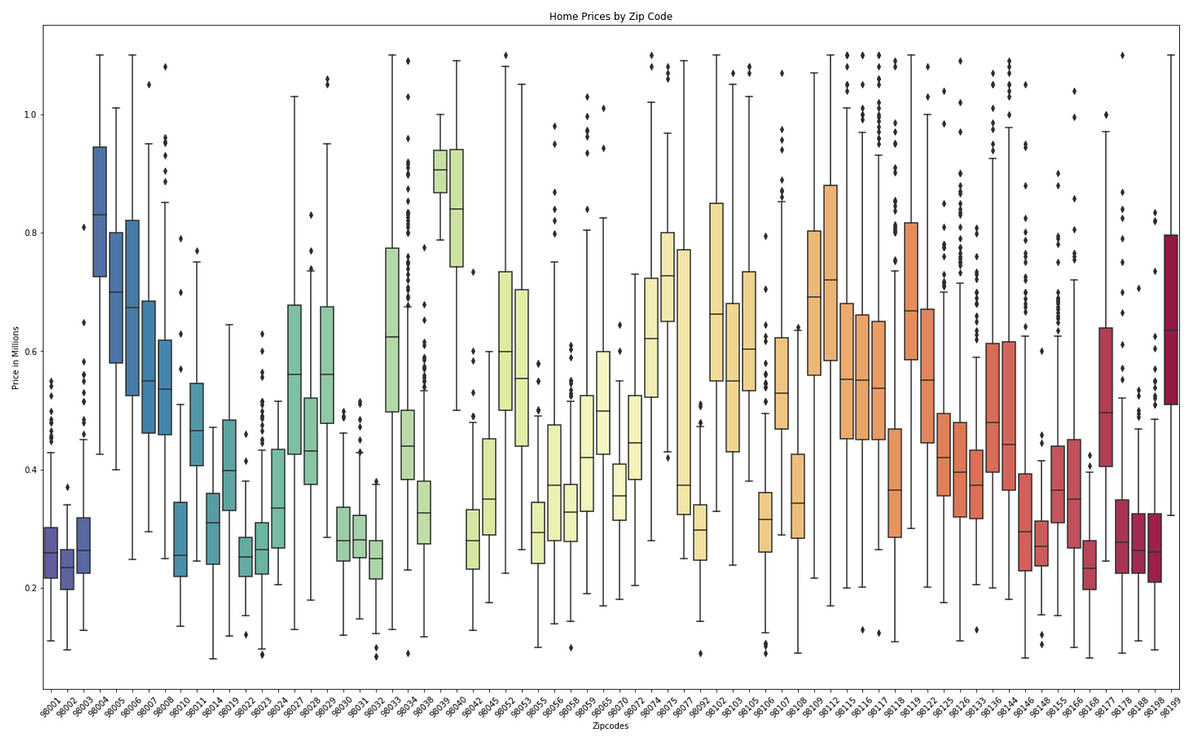
- Zipcode
- Squarefoot (Living, Basement, Lot)
, etc.
Cleaning
The data came to me in fairly good condition. There was still some work to be done before we could start any EDA.

1. Data Types
There were two features that needed to have their data type converted. One simply from text to string.
The other was from text to a DateTime object.
df['date'] = pd.todatetime(df['date'])
Easy as that! The main advantage is that DateTime objects have methods that you can call on them to extract information that you can’t as easily get from a string.
For example, you can easily create a new column that has the day of the week that the home sold on by calling:
df['weekday'] = df['date'].weekday()
Fun! Note - It will actually return a number: 0 = Monday, 1 = Tuesday, etc.
2. Outliers
There is no one right way to handle outliers in the data. In fact, sometimes they contain some useful information that we want to include in our modeling! However, in this case, I wanted a model that would do a good job of predicting the typical home price.
One generally accepted way to deal with outliers is the following.
- Define a reasonable min/max through a method called the IQR (Interquartile Range) Method.
- Calculate the 75th percentile (Q75)
- Calculate the 25th percentile (Q25)
- IQR = Q75 - Q25
- Min = Q25 - (1.5 * IQR)
- Max = Q75 + (1.5 * IQR)
There you go! You can get rid of anything outside of your new min/max range.
3. Missing Values
With continuous variables, missing values can be tricky to deal with. There are a lot of clever ways you can fill them in.
In this case, we only had missing values for categorical variables. This made it fairly simple to deal with. For any feature with missing values, I simply filled them in to maintain the existing ratio between categories.
For example, if my feature had 750 ‘yes’ values and 250 ‘no’ values while having 100 missing values — I simply converted 75 of the missing values to ‘yes’ and 25 of the missing values to ‘no’.
Perhaps this is a naive way of handling missing values but hey, this was only my second data science project ever. ¯_(ツ)_/¯
EDA
With 19 different features, the possibilities for EDA were virtually endless. As to not be a bore, I’ll just show you the EDA that I performed for the three features that ended up making it into my final model.
Feature 1: Waterfront
This feature tells us whether or not a specific property is located on the ‘waterfront’. It probably goes without saying but yes, homes on the waterfront sell for significantly more than their landlocked counterparts.
A lot more.
#regression-analysis #regression #data-science #data analysis