Introduction to the Problem
Nowadays more than ever, the world needs to collaborate in achieving clean energy solutions for fighting the Climate Crisis. The Sustainable Development Goals adopted by all United Nations Member States since 2015 aim to ensure access to affordable, reliable, sustainable, and modern clean energy for all by 2030. Clean energies come from renewable resources supplied by nature, such as sun, wind, tides and waves, geothermal heat, among others. Their use range from electricity generation both in large scale and off grid (for rural and remote areas) [1] to heating/cooling systems and transport. However, renewable sources such as sun and wind energy depend on the weather and are more volatile than traditional sources. As many nations in the world increase their share of renewable energy supplies [2,3], it is important to guarantee that these clean energy sources provide a stable supply while replacing fossil fuel based energies.
In the AI4Impact Deep Learning Datathon 2020, the topic of clean energies was investigated employing Deep Neural Networks. In the first part of the challenge, the teams worked on predicting energy demand using the Kaggle data set containing over 10 years of hourly energy consumption data from PJM Interconnection LLC. You can check some insights from team Deep Delve on this first part of the project in the video below.
The second part of the challenge was dedicated to forecasting wind energies for maximizing trading profits. Together with solar, wind energy is one of the most prominent renewable energies sources, providing 4.8% of worldwide electricity supply in 2018 [4,5] and being responsible for 15% of the electricity consumed in Europe in 2019 [6]. Wind energy is generated by the mechanical power of wind on turbines that generate electricity. Because wind has variable intensity over time and may stop blowing intermittently, electricity produced by this source is commonly combined with other power sources in order to improve reliability and stability.
The economics of wind energy can be understood by considering the trades among different kinds of energy companies. Regional or national energy companies buy pre-determined amounts of energy (measured in kWh) from energy producers, which are companies that operate wind farms (in the case of wind energy). As steady supply of energy is expected from the grid, energy producers can be penalized with substantial fines by governments in the case of power outages.
Energy trade companies play an important role on evaluating the risk of shortfall in energy transactions by helping to _predict the expected energy production _(specially in the case of wind, as a non-steady energy source). Energy traders predict the production of energy (in our case, wind energy) on behalf of the energy producers, taking into consideration two scenarios:
- in the case of a shortfall below the prediction, energy is bought on the spot market to supply the grid (with prices above the average energy price)
- in the case of excess over the forecast production, energy producers are not compensated for the extra energy.
In this sense, precise forecasting of energy production plays a fundamental role for the financial performance of wind farms (i.e. wind energy producers).
Problem Statement
Wind energy is highly dependent on environmental factors such as wind speed. It is critical for energy traders to successfully predict wind energy production in order to maximize profits. By applying Deep Learning to financial risk, we aim to make a wind energy forecast model with a leading time of 18 hours and 1 hour resolution for the _Ile de France _region. The goal is to implement a model that optimizes profits for wind farms, minimizing excess of shortfalls of energy production.
Methodology
In order to evaluate how well our wind energy model performs, we estimate how much monetary profit the model would achieve when compared to real energy produced. The model is tested using real data over time during the evaluation period, following the trading cycle:
- **Warmup: **first 18 hours in which no trades are performed (started on July 22nd 2020, at 00:00 UTC).
- **Trading Period: **produce a wind energy forecast for the next 18 hours (T+18) every hour, including weekends, public holidays, 24/7 (started on July 22nd 2020, at 18:00 UTC).
- Trading ends at the end of the **evaluation period **(July 28th 2020, at 23:00 UTC).
The analysis of financial performance follows the trade methods discussed before, with the following specifications:
- **Price of energy (kWh): **10 euro cents.
- Maximum energy (kWh) sold per day: maximum forecast of the day.
- Energy production excess: energy producer is not compensated for extra energy generated.
- Energy shortage: buy energy from the spot market (20 euro cents/kWh). The amount of energy available to buy depends on the cash at hand and is only possible when a positive balance is available.
- Initial cash reserve: 10,000,000 euro cents for buying energy difference shortage case. This amount is returned at the end of the evaluation.
- **Debt (cumulative): **in a case of shortage in which the cash available in hand is less than required to purchase, a fine of 100 euro cents per kWh is issued. This is recorded as a negative value and added to the cash-at-hand.
Data set
The goal in this project is to forecast the total wind energy production for the Ile-de-France region surrounding Paris. The data for wind energy production comes from the French energy transmission authority Réseau de transport d’électricité (RTE). The data setenergy-ile-de-france contains near-real time wind production from the RTE’s online database, following these specifications:
- Energy production (kWh) in time stamps of one 1 hour, starting from January 1st 2017 at 00:00 UTC to present time.
- Wind forecast data for 8 major wind farms in the region (see table below), from 2 different wind models provided by Terra Weather (16 forecasts).
- Dependent variables: wind speed (m/s) and wind direction (degrees North — for example, a wind direction of 45 degrees means the wind blows from the northeast). Forecasts are updated every 6 hours, and are interpolated to an 1 hour time base. All values for wind speed and direction are estimated from models.
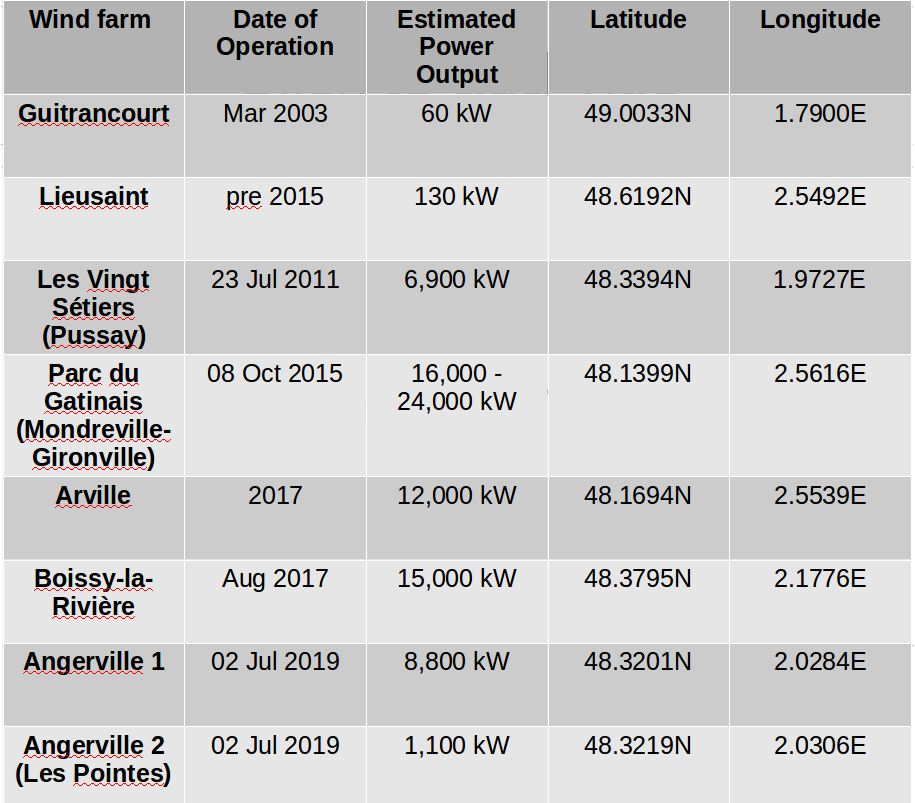
Table 1: Information about the 8 major wind farms in the Ile-de-France region, which were used in the project.
Exploratory Data Analysis (EDA)
Before jumping into the Deep Learning model, we need to first extract insights from the data and work on data preparation. Data extraction and modeling were implemented with Smojo programming language by Terra AI within the Autocaffe platform used throughout the competition.
Statistics and normalization
We start our analysis by obtaining descriptive statistics of the wind energy in our data set, as shown in Table 2. We emphasize that the data was extracted directly from Autocaffe, and is already interpolated therefore not containing any missing values.
Next step is to normalize the data, in order to make all features have a similar range of values. This step is important to not bias the network towards features with higher values, as well as to speed up the learning process. All features were standardized to zero mean and unit standard deviation, following the equation:
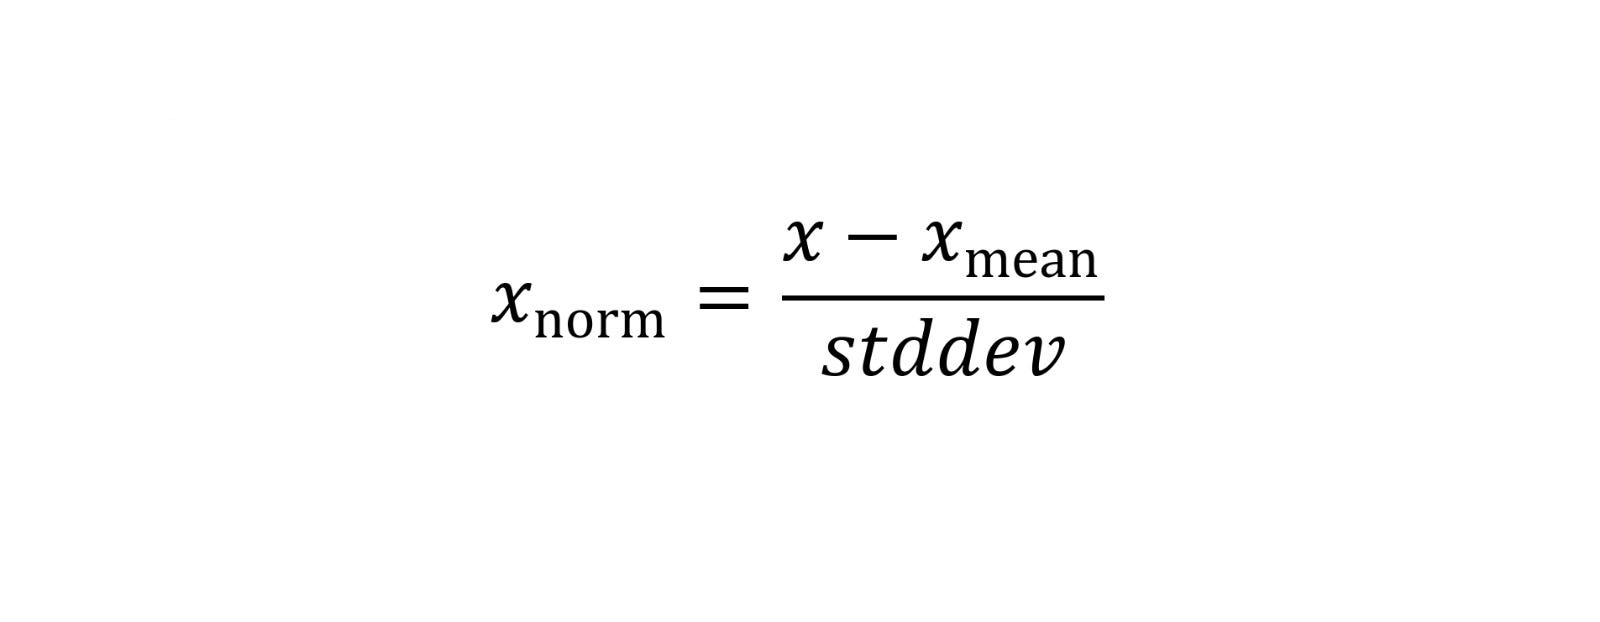
where Xnorm is the value of the normalized input feature, Xmean is the mean value of X and stddev is the standard deviation.
When dealing with forecasting, it is important to define a metric at which one can measure how well the model predictions are in comparison to the real values obtained (actuals). Another important concept when dealing with time series is persistence, which is basically the assumption that the observed values of a quantity in the present are going to be the same in the future (T+X = T+0). The persistence is a trivial forecast model and, therefore, any credible time series model must at least beat the persistence value.
Assuming a Mean Absolute Error (MAE) metric, we identify a persistence of 0.65 for our data set, which is the first benchmark that our model has to overcome.
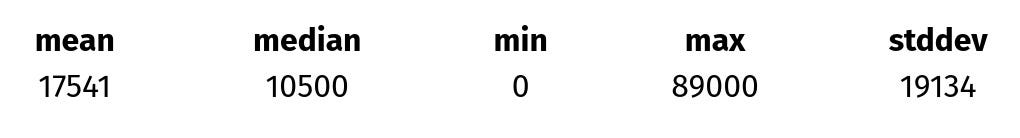
Table 2: Descriptive statistics for wind energy.
Wind Energy Time Series
We start our time series analysis with visualizations of the wind energy production over the years using box plots for Figures 1 and 2. In this visualization, a box corresponds to 50% of the data for each year, the horizontal line inside each box corresponds to the median value, the whiskers (range from box) correspond to the maximum and minimum values (excluding outliers) and finally the circles correspond to outliers (1.5 times the box = distance from the box).
#deep-learning #time-series-forecasting #deep learning