There are at least two inspirations in writing this story. The first inspiration is coming from my participation in Summer School on Galaxies and Cosmology (SSGC 2020). It has three parts: Public Lecture, Lectures, and Workshops. One of the Workshops analyzed the weak gravitational lensing using Oguri et al. (2012) as the primary reference. Oguri-san gave the participants his code to analyze the lensing, including the Maptlotlib parameter settings. I won’t talk about the gravitational lensing, but how to generate a professional plot using Matplotlib, as shown in Oguri-san paper.
The other one comes from when I was reading the General Instructions to submit an article in Monthly Notices of the Royal Astronomical Society (MNRAS), one of the world’s leading primary research journals in astronomy and astrophysics. One of the parts in the instructions is how to embed figures in MNRAS. The authors are advised to ensure the color used in their figures are color-blind friendly. Here, I quote the instruction.
Where possible, please ensure that your figures are color-blind friendly. The use of red and green in the same figure is particularly problematic for some readers (General Instructions from MNRAS)
I was surprised by the instruction. I did not realize that we need to provide color-blind friendly in my figures/plots because I have no problem with color. After understanding it, I suggest you (all of the readers) perform color-blind friendly in your figures/plots. I will explain more about color blindness in the next part.
Main Goals
This story will guide you on how to:
- Customize Matplotlib parameters, using plotting style and rcParams
- Choose color-blind friendly
This story is significant for you who boost your data visualization skills because I will share how to generate professional plots based on the main goals mentioned before. So, let’s start it.
1.a Customize Matplotlib plotting style
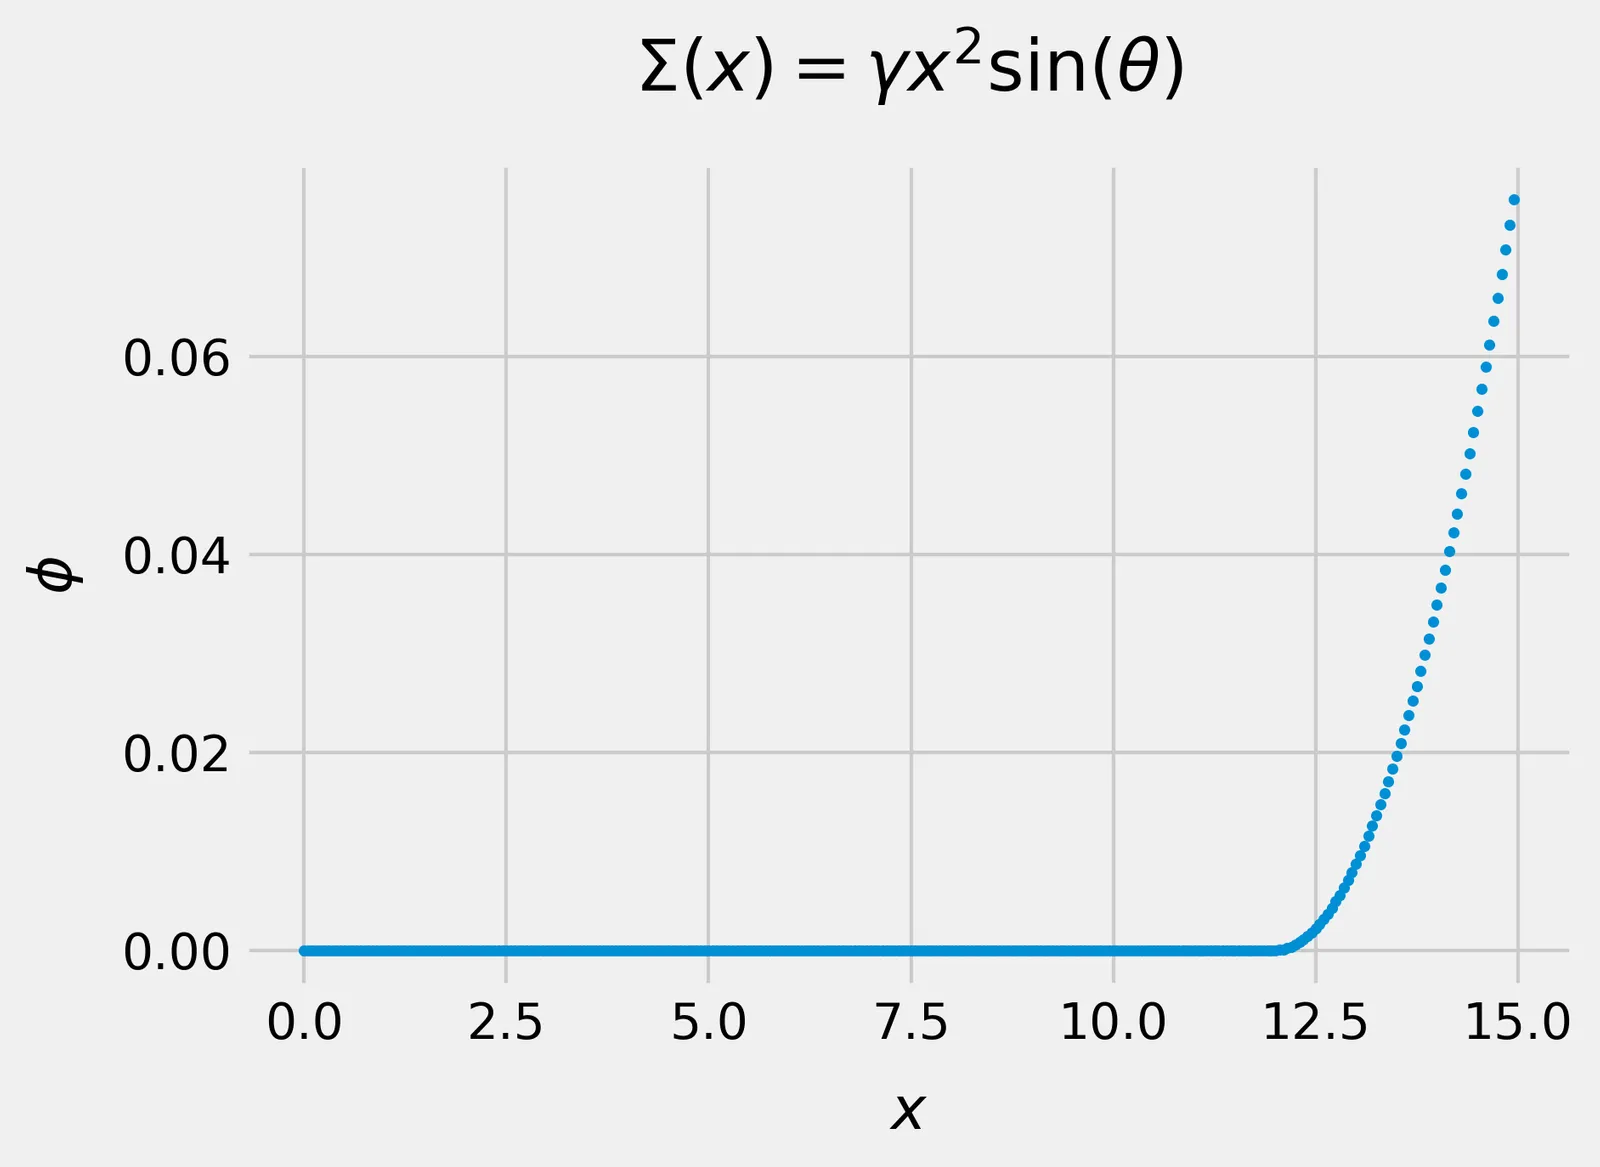
Matplotlib provides users the style package to customize plotting style. If you did not change the style, you would get a default style, as shown in Figure 1.

Figure 1. Default plotting style in Matplotlib (Image by Author / Rizky MN).
By default, the background color is white, and the first color for the plot is blue. You can change it using style syntax, as shown in the following code.
import matplotlib as plt
plt.style.use('fivethirtyeight') ## fivethirtyeight is name of style
#artificial-intelligence #machine-learning #data-science #programming #data-visualization