We will be constructing an Operational Dashboard in React for an ecommerce store, utilizing a number of charts and components from KendoReact.
A dashboard is only as good as the information it portrays which helps solve a specific need. There are four main types of dashboards:
- Strategic: Help guide long term company strategy, often high-level
- Operational: Look at current performance, guiding alignment to the company’s KPIs
- Analytical: Contains large amounts of data used by analysts
- Tactical: Used to analyze and monitor a process
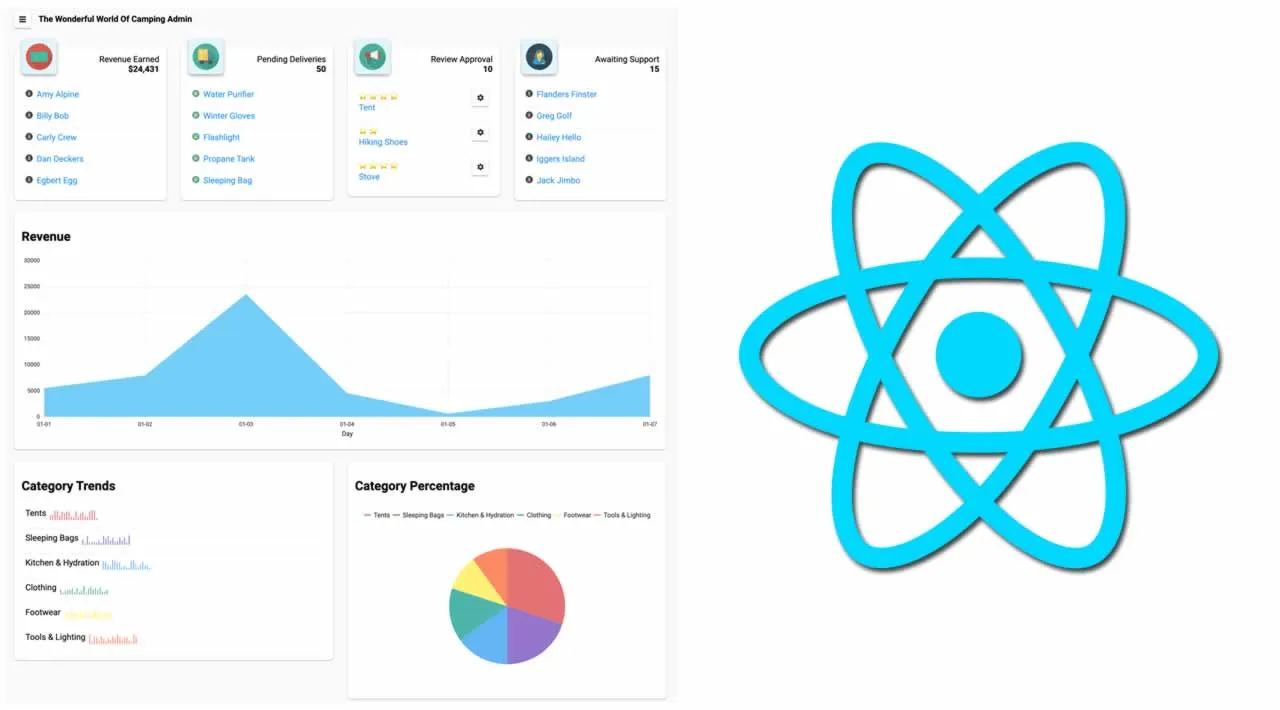
In this article we will be constructing an operational dashboard in React for an ecommerce store, utilizing a number of charts and components from KendoReact. We will begin by discussing our needs, move into the design and planning phase, and then discuss the actual code to implement it.
Full source code of this project can be found here
Dashboard Must Solve a Real Need
Imagine an ecommerce store named “The Wonderful World Of Camping” (TWWOC). It specializes in gear, clothing and tools related to, you guessed it, camping! Our company goals are as follows:
- Be Financially Sustainable: Without revenue, our ecommerce store will struggle to succeed. This is a bootstrapped business without VC funding, so revenue is especially important.
- Provide Quick Delivery: Always aim to keep Pending Deliveries low. When a customer orders an item, shipment should be as quick as possible.
- Foster Community Engagement: This is done by allowing customers to leave their feedback and reviews of the products we sell.
- Give Excellent Support: A customer should receive quick, helpful, and friendly support at all times.
#react #javascript