The evaluation metrics for classification models series consist of multiple articles linked together geared to teaching you the best practices in evaluating classification model performance.
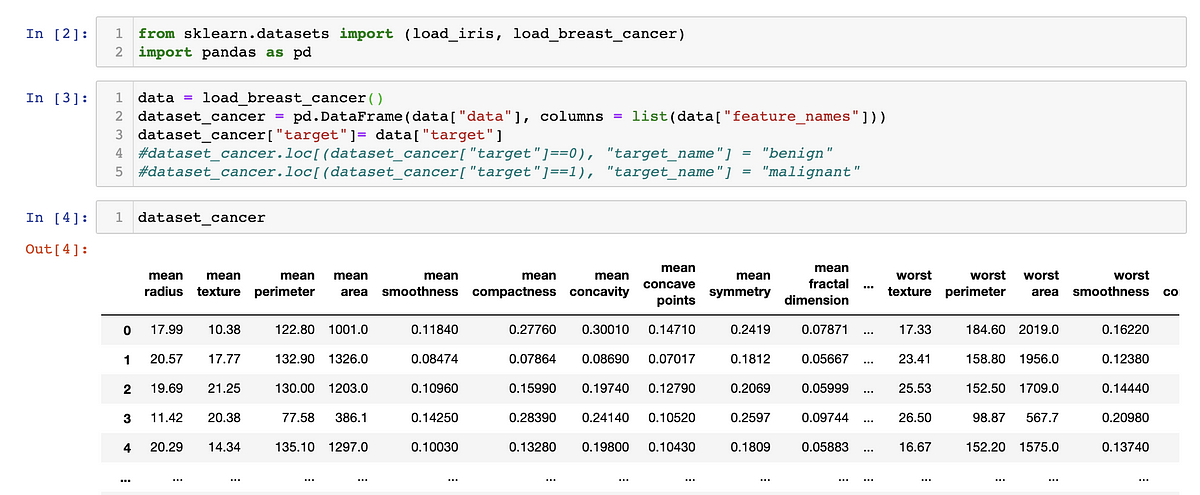
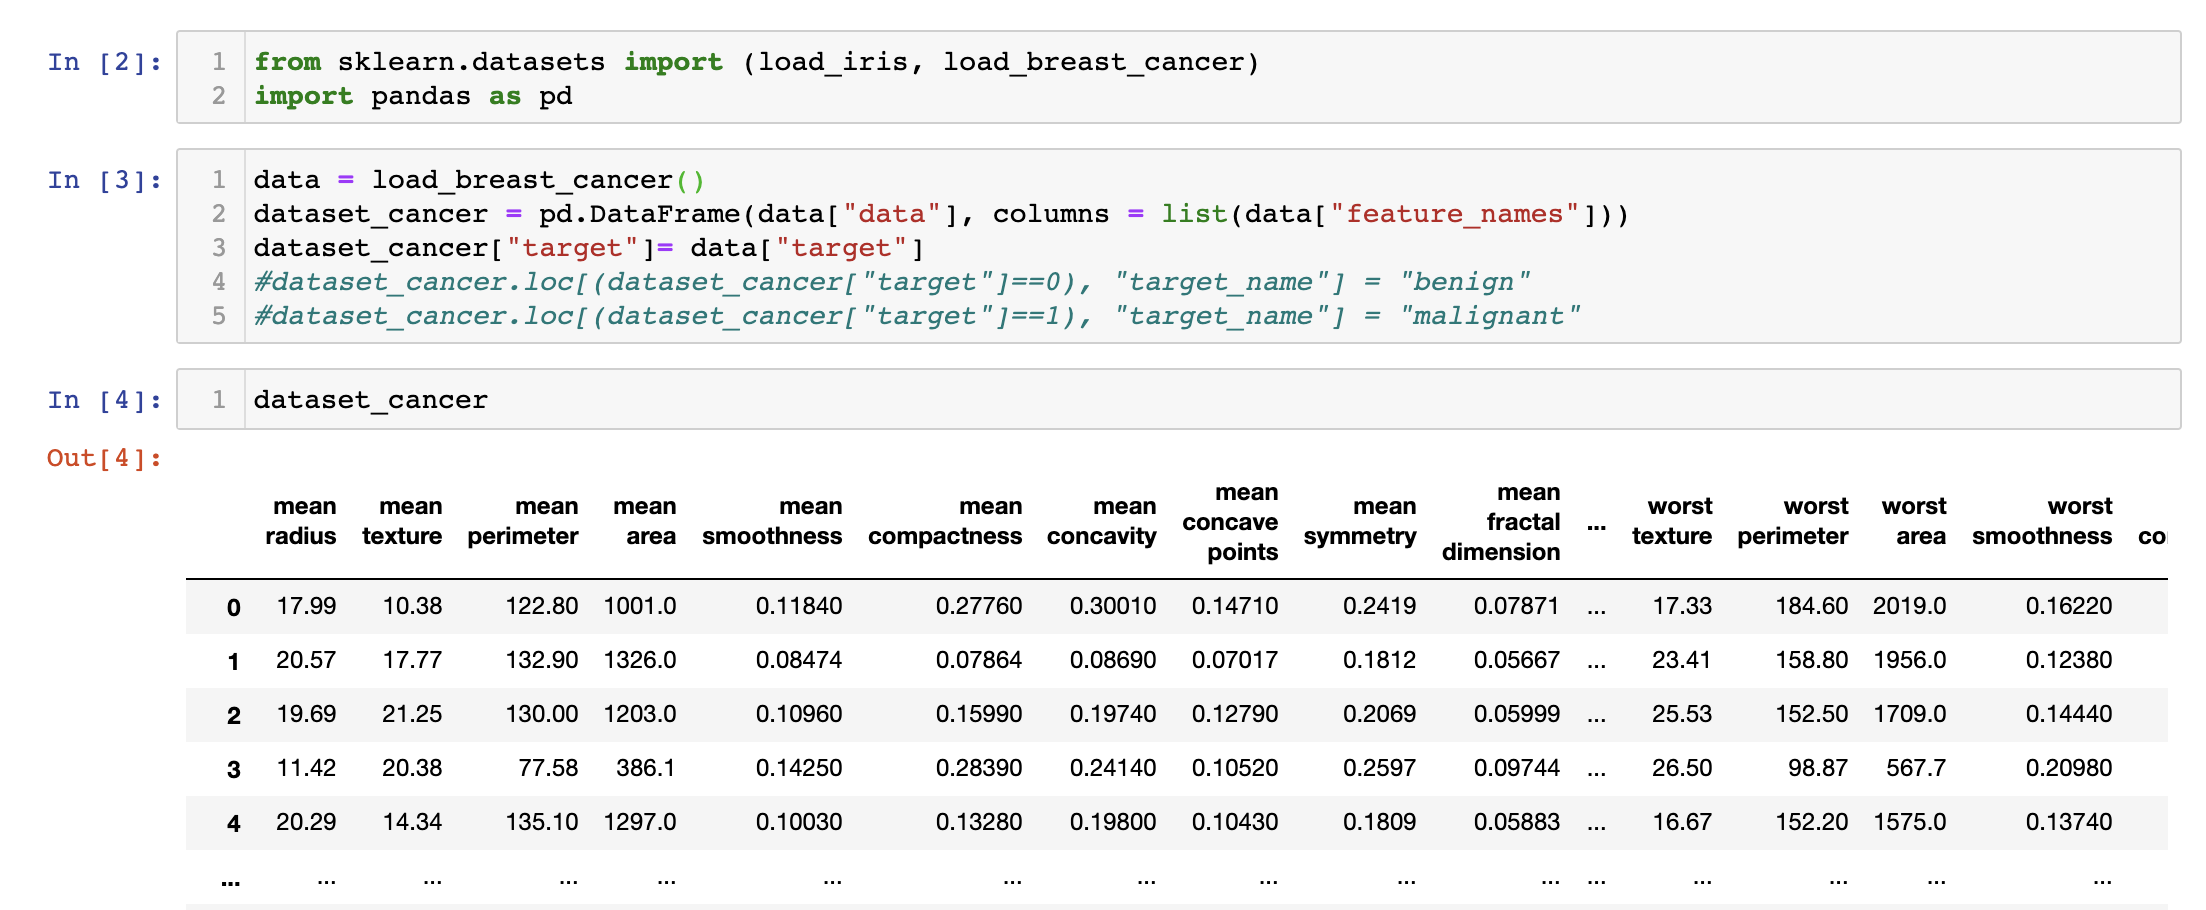
For our practice example, we’ll be using the breast cancer dataset available through “sklearn”. We take the following steps in preparing our data:
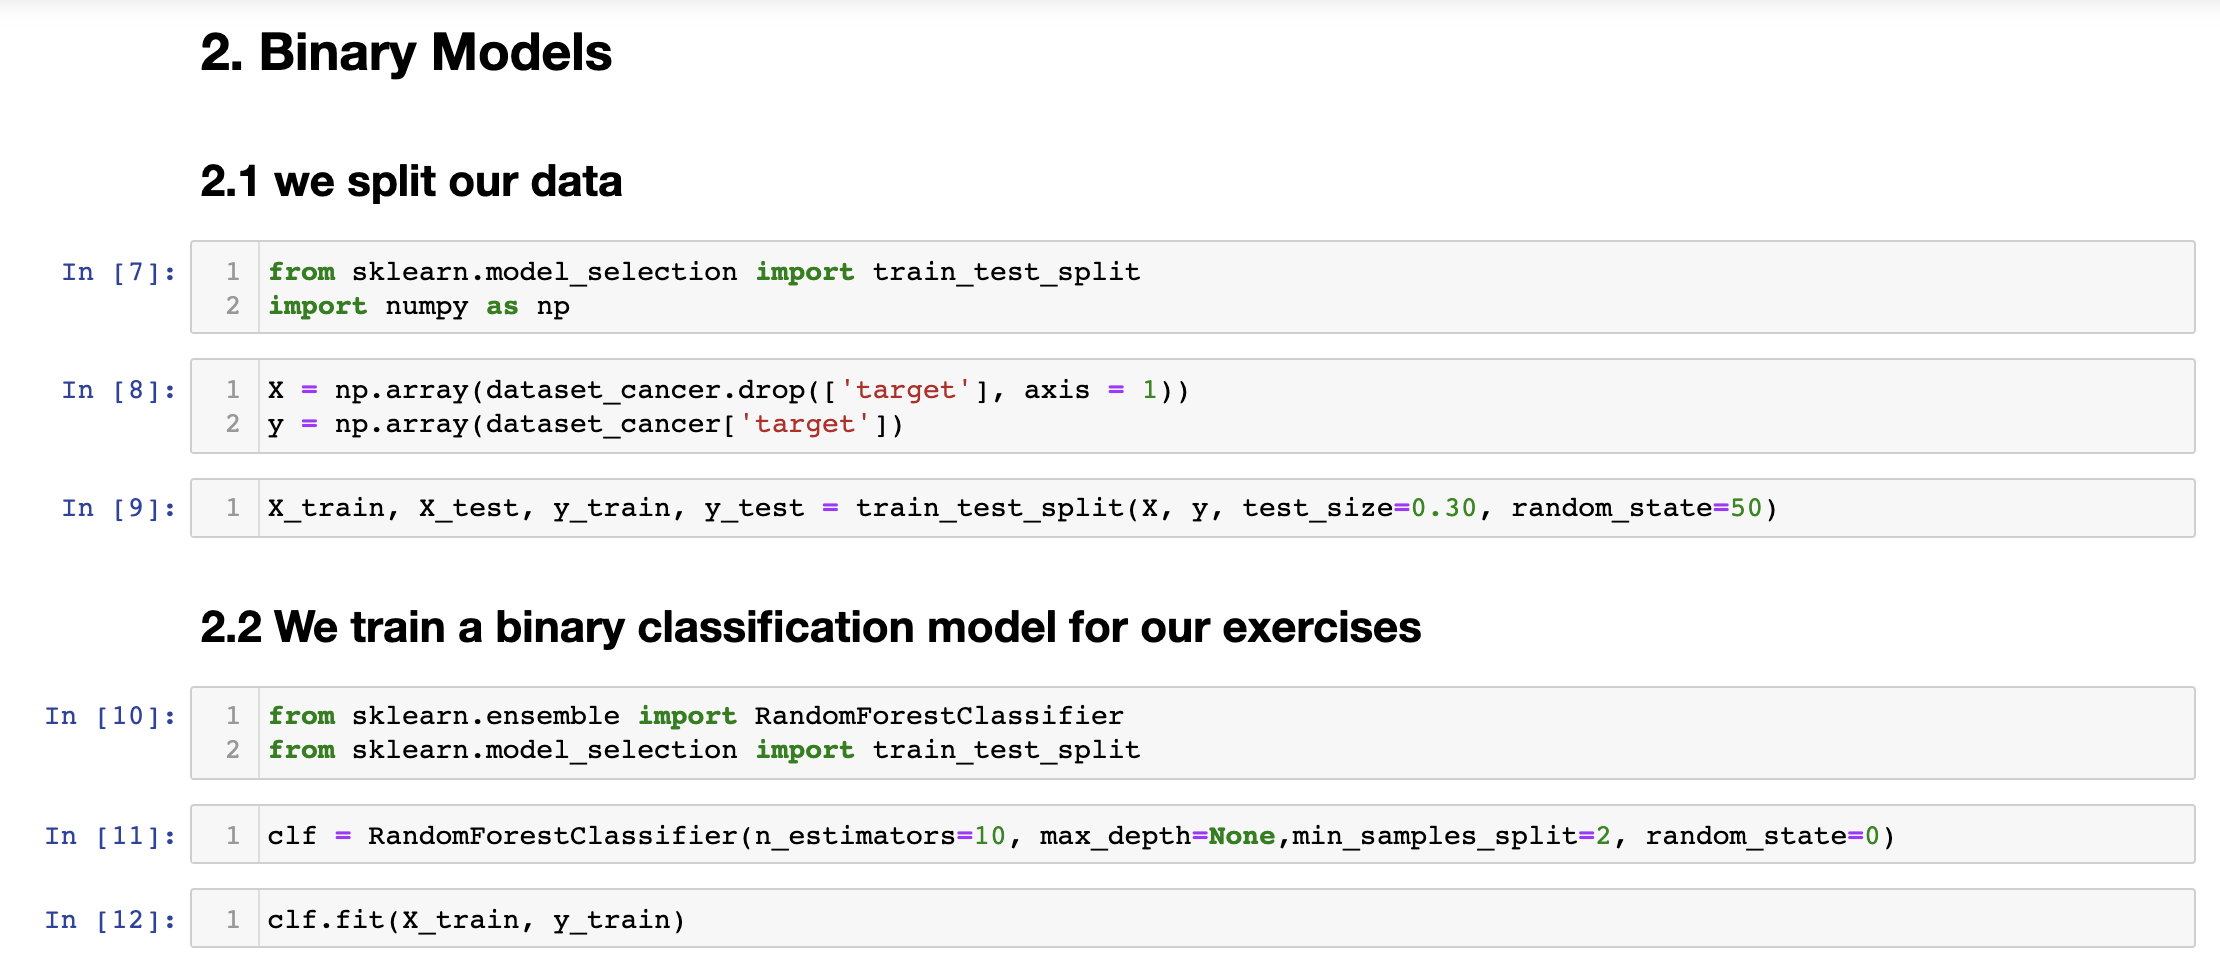
Next, we will proceed to split our data and train a binary classification model to evaluate.
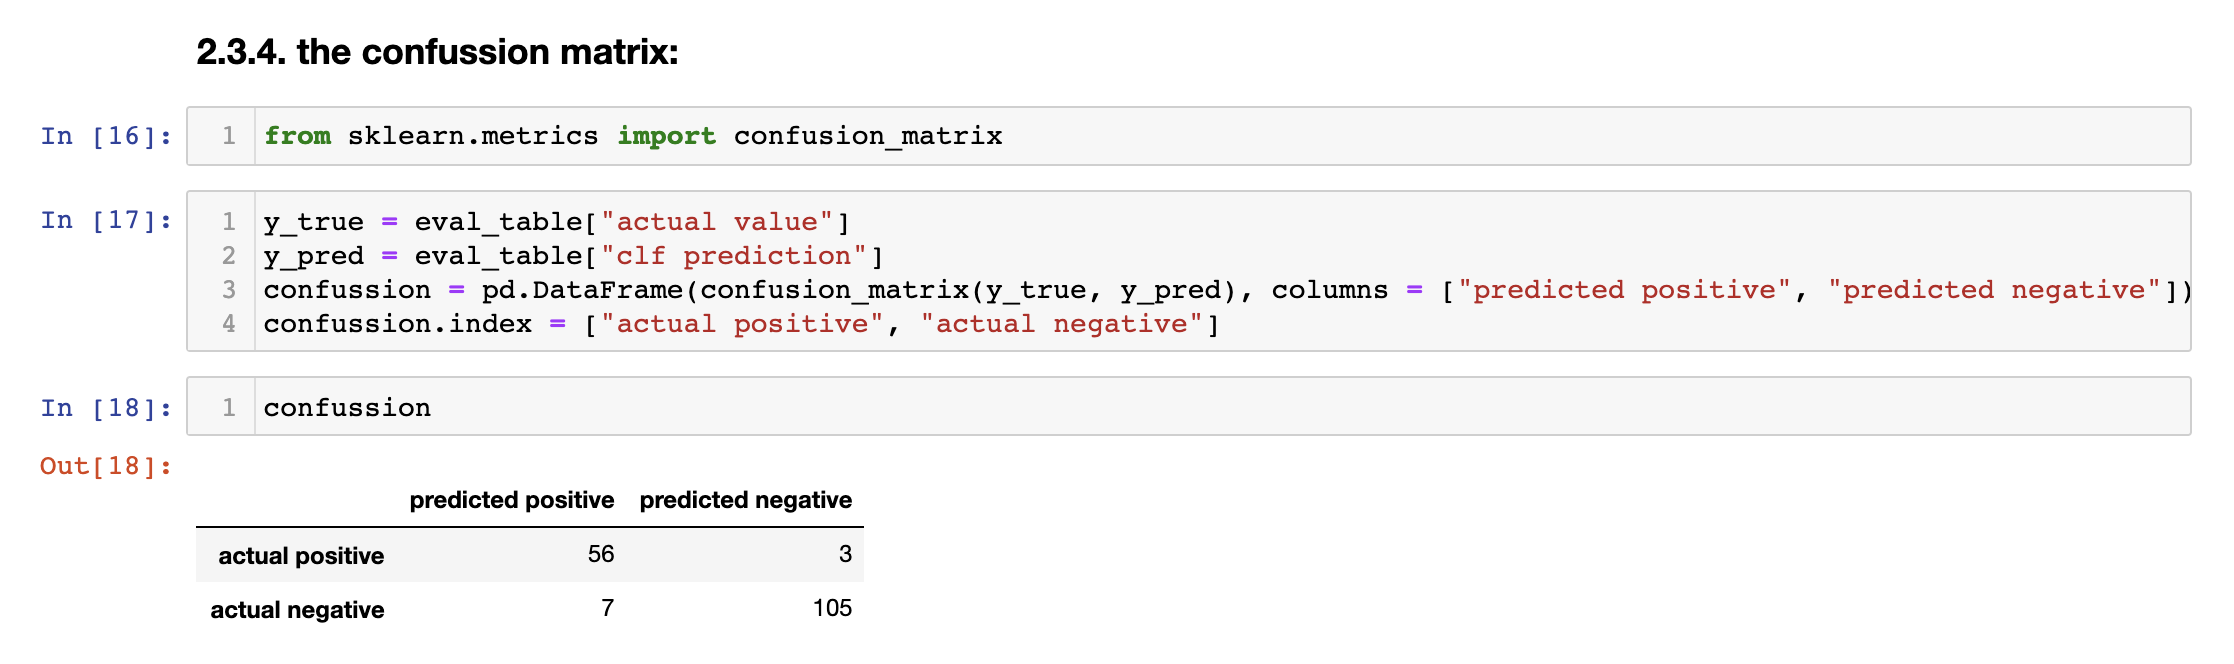
We will create a table called evaluation_table with the actual and predicted values.

We look up the percent of malignant vs benign observations.

By looking at the percent of total observations in our sample that have actual (real) malignant cancer vs the percent that have benign, we analyze how balanced our sample truly is.
The imbalance we are dealing with is truly just 65:35. It is slightly imbalanced but is not of much concern. In a future article, I’ll be illustrating how to deal with highly imbalanced datasets.
#evaluation #machine-learning #data-science #classification