In part 1, we were able to hook up our data and render the periodic table using Svelte. If you need a short refresher, you can find part 1 here ( https://medium.com/javascript-in-plain-english/periodic-table-of-elements-in-svelte-52fafddb19dd).
Currently, our periodic table doesn’t do anything interesting, and honestly doesn’t add any extra value over a print version. Let’s change that by adding some interactivity to make it more useful. In the process, we also get to see how components communicate in Svelte and how easy it is to wire things up.
Project setup
If you are continuing from where we left off in Part 1, you can continue from there. If you somehow lost or can’t find the project, you can always clone the repository and install the dependencies as show below:
git clone https://github.com/kinxiel/Periodic-Table-of-Svelements.git

cd Periodic-Table-of-Svelements/
npm install
npm run dev
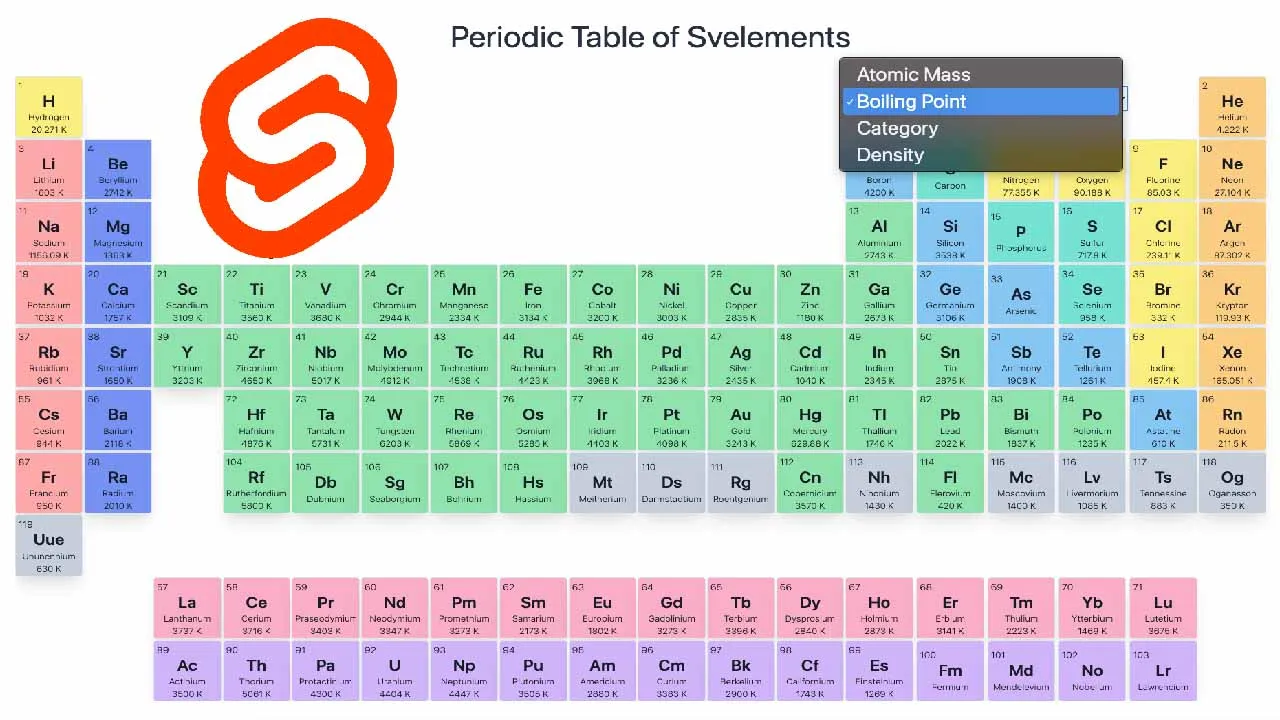
If there are no errors, head over to localhost:5000 to find your rendered periodic table.
#periodic-table #javascript #programming #svelte #web-development