Hi Friends,
Today I want to write about customer segmentation and some technic. As we know all businesses need some optimization for advertising and customer segmentation is a logical way. In addition, segmenting your customers will help you predict their next behavior. For example, you can find your customers who will leave you after 1 month.
So what do I want to do for the project?
An e-commerce company wants to segment its customers and determine marketing strategies according to these segments.
For this purpose, we will define the behavior of customers and we will form groups according to clustering.
In other words, we will take those who exhibit common behaviors into the same groups and we will try to develop sales and marketing techniques specific to these groups.
Very cool right. Ok, Let’s start moving forward:
- Import the dataset,
- Understand the dataset,
- Cleaning the dataset,
- Explore the dataset with questions,
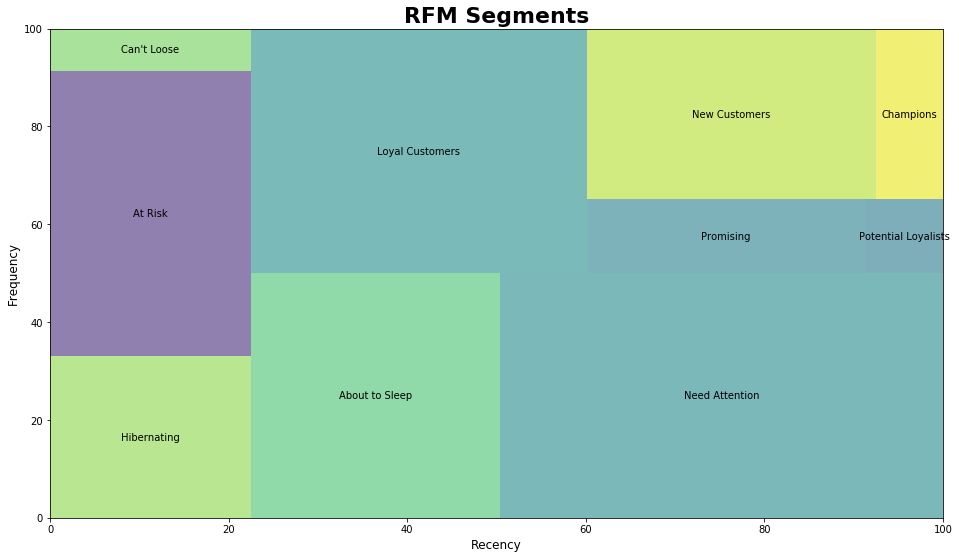
- Calculate the RFM scores,
- Segment the customers,
- Visualization of the data,
- Creating strategies according to customer segmentation.
Import dataset
I’ll use the data shared by the Center for Machine Learning and Intelligent Systems. here https://archive.ics.uci.edu/ml/datasets/Online+Retail+II
- This Online Retail II data set contains all the transactions occurring for a UK-based and registered, non-store online retail between 01/12/2009 and 09/12/2011. The company mainly sells unique all-occasion gift-ware. Many customers of the company are wholesalers.
- In the dataset, you’ll see 2 sheets. I’ll use “Year 2010–2011”.
I’ll need libraries for the project,
import pandas as pd
import numpy as np
import seaborn as sns

# to display all columns and rows:
pd.set_option('display.max_columns', None); pd.set_option('display.max_rows', None);
# The number of numbers to show after the comma.
pd.set_option('display.float_format', lambda x: '%.0f' % x)
import matplotlib.pyplot as plt
Import the dataset to the notebook,
df = pd.read_excel("/Users/Desktop/online_retail_II.xlsx",sheet_name = "Year 2010-2011")

df.head()
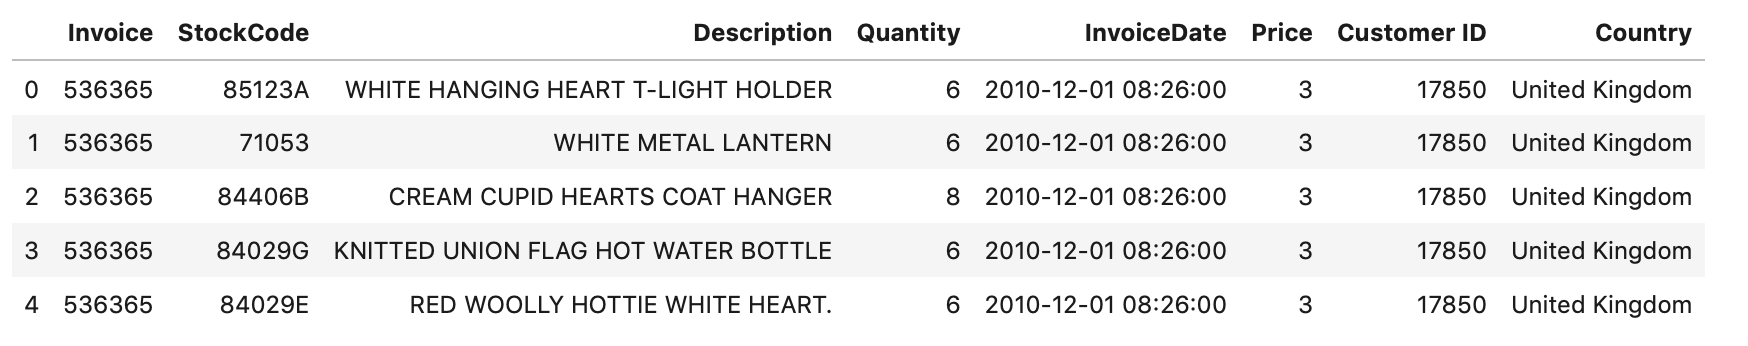
structure of the dataset
Understand the dataset
Variables
- Invoice: Invoice number. Nominal. A 6-digit integral number uniquely assigned to each transaction. If this code starts with the letter ‘c’, it indicates a cancellation.
- StockCode: Product (item) code. Nominal. A 5-digit integral number uniquely assigned to each distinct product.
- Description: Product (item) name. Nominal.
- Quantity: The quantities of each product (item) per transaction. Numeric.
- InvoiceDate: Invoice date and time. Numeric. The day and time when a transaction was generated.
- UnitPrice: Unit price. Numeric. Product price per unit in sterling (£).
- CustomerID: Customer number. Nominal. A 5-digit integral number uniquely assigned to each customer.
- Country: Country name. Nominal. The name of the country where a customer resides.
Cleaning the dataset
TASKS:
- Clean the returns, they start with “C”.
- Clean the wrong enter items, they start with “wrong”
- drop the null data.
df1 = df[~df["Description"].astype(str).str.startswith("C")]
df2= df1[~df1["Description"].astype(str).str.startswith("wrong")]
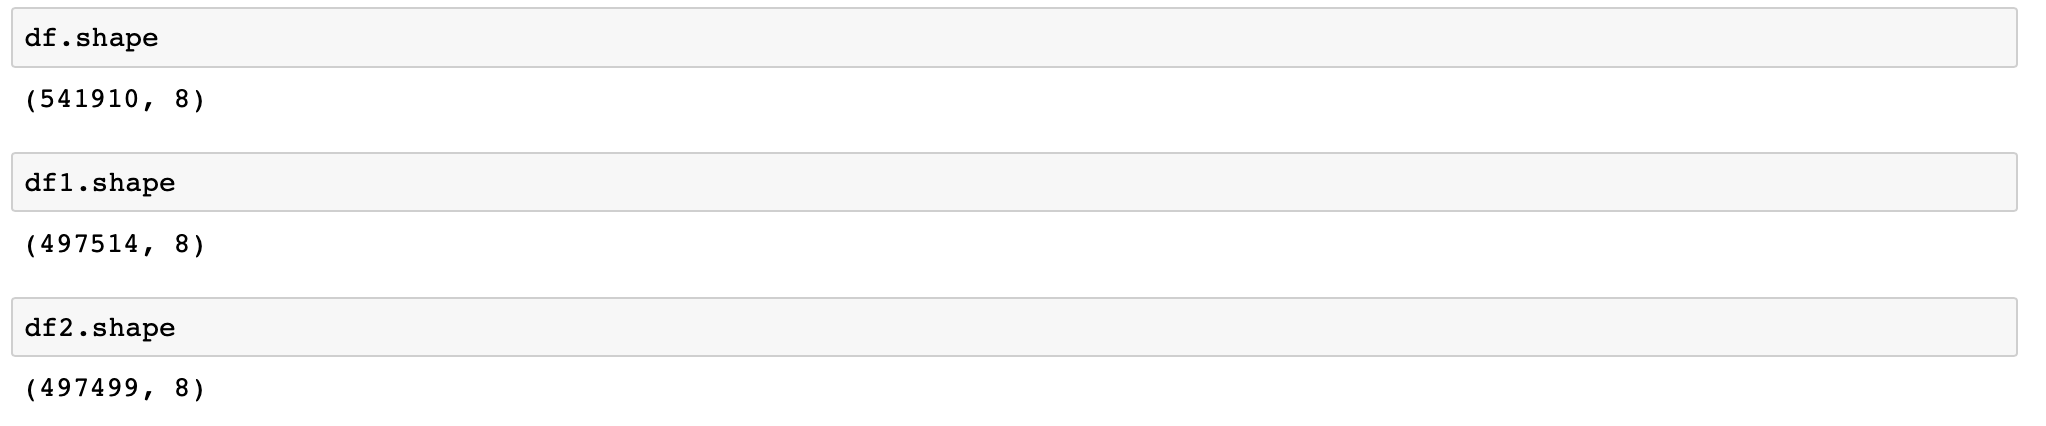
data shape after drop the “C” and “wrong”
df2.isnull().sum()

Invoice             0
StockCode           0
Description      1454
Quantity            0
InvoiceDate         0
Price               0
Customer ID    123185
Country             0
dtype: int64
Customer ID the most important variable for this project. That’s why I’ll drop the null Customer ID. Also, the Description variable has not large null data. I’ll drop it too.
df2.dropna(inplace = True)

# Here the last data
df2.shape
(374314, 8)
#python #rfm-analysis #segmentation #data-science #data analysis