This report visualizes the data of the life expectancy of the countries across the World. Also, it tries to establish a relationship between life expectancy and GDP per capita of the countries.
A comparative study has been conducted on the top ten and bottom ten countries of 2017 with their life expectancy in 1987. As there is a difference of 30 years, this analysis helped to understand the increase or decrease in the expected years of life in the countries taken into account.
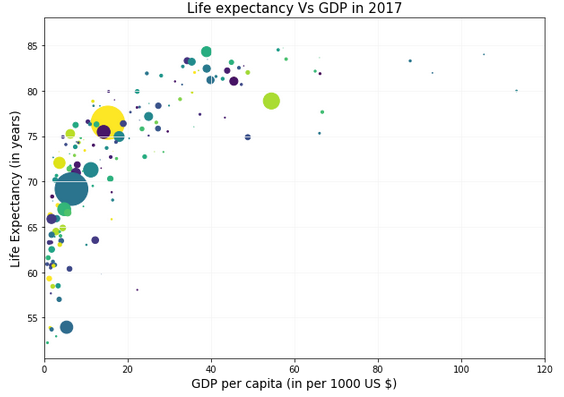
Moreover, it is very obvious that life expectancy is affected by factors such as happiness, pollution, terrorism, diseases, and many more but I tried to compare the life expectancy with the GDP per capita of each country. As a result, countries with better GDP per capita provided better life expectancy to their citizens in comparison to the countries with a lower GDP per capita.
#our-world-in-data #data-visualization #gdp #life #python