Note from the editors:Towards Data Science_ is a Medium publication primarily based on the study of data science and machine learning. We are not health professionals or epidemiologists, and the opinions of this article should not be interpreted as professional advice. To learn more about the coronavirus pandemic, you can click here._
In continuation of my previous posts about COVID-19 data endpoints and their visualization, here is a quick way you can build a simple time series forecasting model: -
For those who are not familiar with what time series forecasting is: A time series is a series of data points indexed (or listed or graphed) in time order. Most commonly, a time series is a sequence taken at successive equally spaced points in time. In a forecasting setting, we find ourselves at time t and we are interested in estimating Y(t+h), using only information available at time t.
I have personally used the Autoregressive forecast model. An Autoregression is a time series model that uses observations from previous time steps as input to a regression equation to predict the value at the next time step. It is a very simple idea that can result in accurate forecasts on a range of time series problems.
- As always, we start with importing the required modules
import requests
import pandas as pd
from statsmodels.tsa.ar_model import AR
And then we fetch the required data from its respective endpoint accordingly and train the Autoregression model with it.
x = requests.get('https://api.covid19api.com/total/country/india/status/confirmed').json()
df = pd.DataFrame.from_dict(x)
model = AR(df['Cases'][:-1])
model_fit = model.fit()
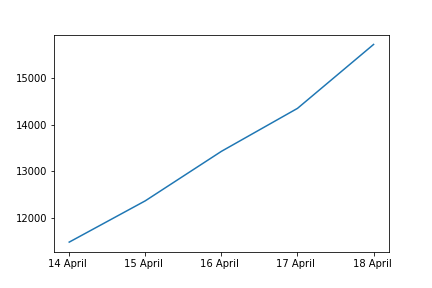
Here for training, I have only used data till 17–04–2020 so that I can use it to predict the total number of confirmed cases on 18–04–2020 and compare it with the actual value.
Now to predict the value of 18–04–2020 (i.e. the 87th value in the list of data hence the number 87 beside the predicted value) I have passed the start and end index parameters to the predict function as the total length of the input data as that will give the index of required prediction (i.e. if I have 87 values the index of last input value will be 86 and the value passed as start & end param would be 87, telling it to predict the 87th value).
#covid-19-india #timeseries-forecasting #autoregressive #data-science #covid19 #data analysis