The Diagnostic Report utility was recently brought into the Node.js core to help developers identify almost all scenarios of Node.js application anomalies in production. The scenarios include abnormal termination such as a crash, slow performance, memory leak, high CPU, unexpected errors, incorrect output, and more.
While the report does not pinpoint the exact problem or specific fixes, its content-rich diagnostic data offers vital hints about the issue and accelerates the diagnostic process.
The utility was originally available as a npm module, and was brought into the Node.js core because it significantly helps identify the root cause of numerous types of problems, including support issues sent to the different repositories in the Node.js organization. Before it was part of the core, you had to explicitly add the dependency to the npm module in a users’ application, which was a blocker for adoption of the diagnostic tool.
In this blog post, I describe why this tool is important, and then go into some detail on how to interpret the report data, and towards the end of the post, walk you through some example use cases.
Common diagnostic steps
Typically, the starting point to diagnose a problem in an application is to:
- Capture data to understand the execution environment of the deployment
- Define a debugging strategy based on the information you obtained
- Execute one or more investigative steps. Potentially, each step could change what you look for or do based on the inference from the previous steps
- Iterate until the current theory is confirmed by the data captured
Problem determination of Node.js deployments involves a number of different tools and methodologies. The problem itself determines the action you take to resolve the issue.
For example, if your application crashes, you would:
- Load the crash dump into a debugger
- Examine the failing context in the failing thread
- Go through the execution sequence backwards to identify what code flow or data flow led to the anomaly and what application, third party, runtime code, or configuration is responsible for the said code flow or data flow.
For an issue related to a memory leak, these steps might be different.
Problem determination problems in production-grade deployments
For production-grade deployments, the approach for diagnosing the problem that I outlined above poses a number of challenges, specifically:
- Unintended business impact. The steps can be iterative, and if followed, can cause unacceptable impact to the business that the production system represents. Even if they’re not iterative, they can cause the debugging task to be delayed. For example, the next data capture needs to wait until the next recycle, which is weeks away.
- Prone to human error. These diagnostic steps can be error prone depending on the skill level of the person who’s conducting them. For example, an IT admin who carries out the steps at the production site is not skilled enough with Node.js diagnostics.
- Knowledge gaps. Many times, additional settings need to be set on the system to collect data. For example, you might have to change ulimit settings to enable a dump or enable gc logging to collect the heap statistics and gc activities.
- Data collection limitations. Many times, the required data may not be easy or even possible to collect. Examples of hard to collect data include: How many handles were in the event loop? What states were those are in? Which SSL library the Node executable was linked against?
- Binary data hurdles. Because the data is being collected in binary format, many times, the user or admin has no idea what debugging process is being carried out or what data is being collected. Sometimes it’s hard to gain approval for forwarding binary data to the devs who can resolve the issue versus a readable format which can more easily be reviewed and sanitized.
Solution
The solution is useful documentation that explains the most common diagnostic data that is pertinent to your specific execution environment. Diagnostic Report does this using first failure data capture (FFDC). This document is in semi man-machine readable format, so you can read it in its original state if you’re moderately skilled at diagnostics reporting or it can be loaded into a JS program or passed to a monitoring agent.
This document can improve the overall troubleshooting experience because it:
- Answers many routine questions which can reduce the number of iterations needed to understand the cause of the failure.
- Offers a comprehensive view of the state of the application and virtual machine at the time of failure. This information can drastically improve the decision making for the next set of data collection, if required.
Ideally, the FFDC enables someone to resolve the issue without any additional information!
Function
Diagnostic Report is an experimental tool that is built into the Node.js core. Its function is to produce a JSON document about points of application misbehavior, or at a point where the user is interested in getting more information. The document produced contains information about the state of the application and the hosting platform, covering all the vital data elements.
The following command line argument runs Diagnostic Report (there are many other ones but this is one).
$ node--experimental-report --diagnostic-report-uncaught-exception w.js

Writing Node.js report to file: report.20190309.102401.47640.001.json
Node.js report completed
Data that it captures could be related to anomalies like fatal errors that terminate the program, application exceptions, or any other common failure scenarios. The data that the tools actually captures could be JavaScript heap statistics, native and application callstack, process’ CPU consumption, and more.
A few command line arguments are available to control the report generation triggers and the report generation behaviors.

You can also generate the report explicitly via an API which is exposed through the Node.js process object. When using the API, the report is available both as a disk file or a JSON string. Another API controls the report generation triggers and reports generation behaviors.
Use cases
In this section, we illustrate some of the benefits of Diagnostic Report through a few different use cases. Keep in mind that this list isn’t exhaustive. Diagnostic Report is a general-purpose tool that can be used in any problem scenarios.
- Identify which SSL library the current Node installation is linked against (roughly identify the distribution).
- In this case, you can produce a report through the
process.report.writeReport()API. As the following image shows, the component versions section contains theSSLlinkage information. In this case, it is linked against version 1.1.1b of openssl (line 12). 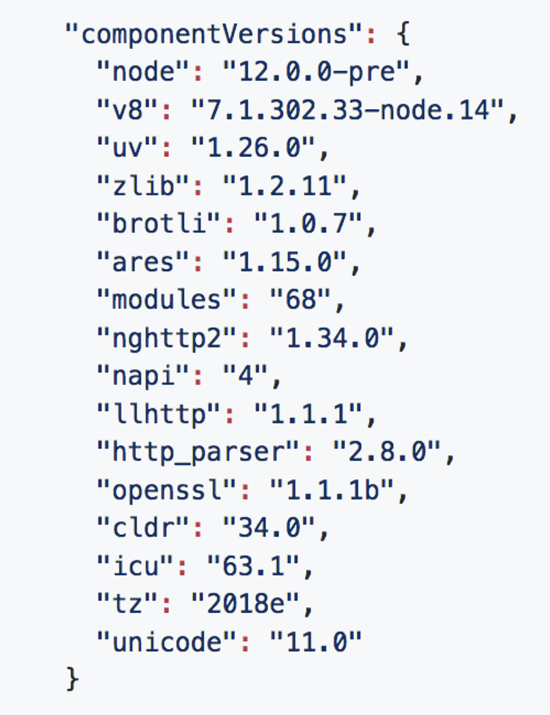
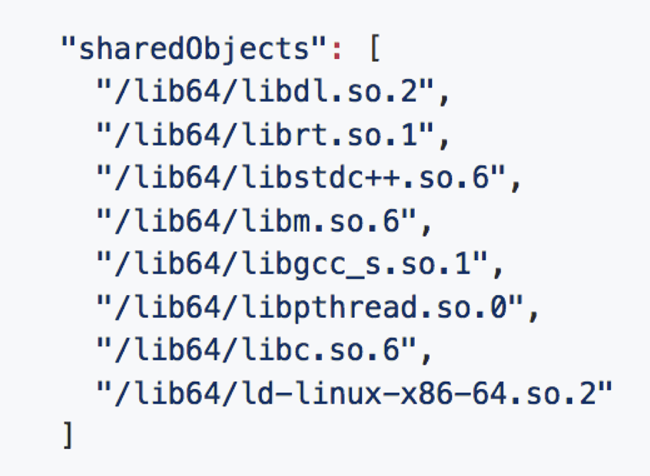
- Reviewing the shared libraries that Node is linked against, you see no external SSL libraries in the list. From there, you can conclude that this is a standard community distribution.
- A Node application hangs when you expect it to complete some tasks and then terminate. You have no idea what is causing the event loop to engage.
- In this case, produce the report by sending a SIGUSR2 signal to the running process.
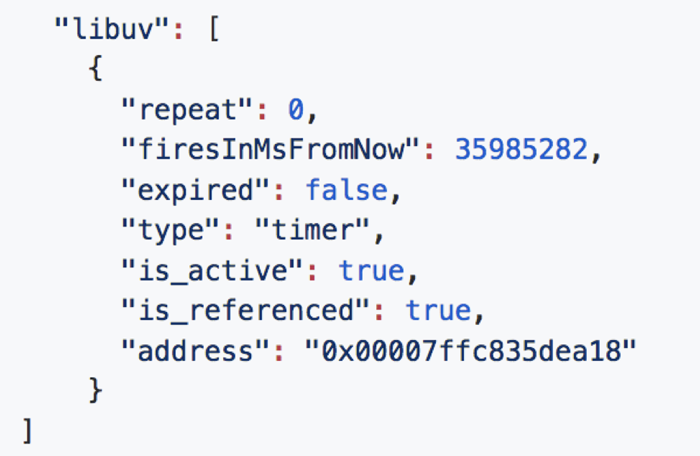
- The generated report shows an active timer handle lying in the loop that has an expiry time of around 10 hours from the current time. (You can see that on line 4; “firesinMSfromNow” shows how many milliseconds it takes to fire).
- Because the application should not be scheduling an event for 10 hours in the future, you now understand the reason for hang. To fix, search in the application that installs a setTimeout handler with the said duration.
- You to make sure a web application that you host in a cloud environment is idle outside of business hours.
- In this case, you again produce a report by logging into the cloud instance through SSH and sending a signal to the running process. The report generated in the persistent volume showed the resource usage section:
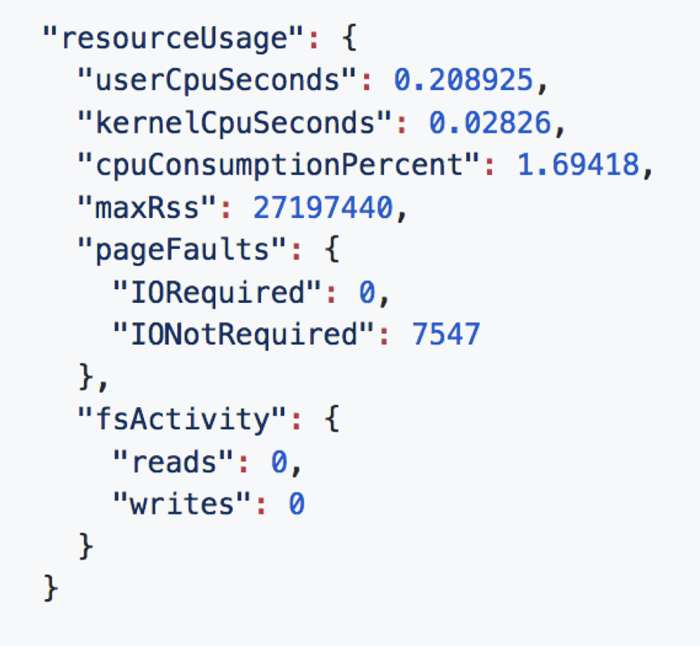
- Lines two and three show the time spent by the node process in the user space and kernel space. Because they were only a fraction of a second spent, you can be confident that the application is relatively idle, with no file system activities in the recent past.
We need your feedback
Diagnostic Report is available as an experimental feature from Node.js v11.8.0 and subsequent releases. The tool could exit the experimental status and become a stable and supported feature, based on:
- The perceived usability in the field
- Any fine-grained tuning that may be required at the API interface level.
Again, this is based on user feedback.
In software development, ‘feature freeze’ is the inability to refine interfaces because they are already massively used in the field and have many software abstractions built on top of them; any changes to the interfaces can break all these.
To avoid feature freeze with our Diagnostic Report tool, we ask that you evaluate this feature as soon as you get an opportunity and provide your valuable feedback directly in the Node.js Diagnostic User Feedback repo.
#node-js #npm
