Analyzing the test results using Python.
In theory, there is no difference between theory and practice, but
practice, there is.
My previous blog gives a basic idea of what exactly is A/B testing. From the positioning of images on pages, to the checkout process, we are staunch advocates of A/B Testing. Knowledge of a concept is not enough, implementation of this knowledge gives the best exposure of learning.
This blog is a walkthrough of an A/B testing case study that I have worked on as part of Udacity’s Data Analyst NanoDegree Program. This case study is developed and used by Udacity in many of their programs.
“Audacity” is an online learning platform that offers a wide variety of courses, degrees, and certifications to the students. So, the customer funnel for a typical new user on the Audacity website would be as follows:
Homepage -> Explore Courses -> View Course Overview page -> Enroll in course -> Complete the Course
Just like any other website, there would be greater number of users at the top of the funnel than the bottom.
Audacity loses users as they go down the stages of this funnel. So, it decided to test features that can increase student engagement. Audacity is performing A/B test to try out changes that will hopefully increase the conversion rate from one stage to the next.
The first change that they decided to bring in was the homepage design. Audacity decided to optimize its homepage so that the new, more engaging design will increase the number of users to explore their courses.
This basically covers two stages of the funnel, Homepage -> Explore Courses
An experiment was setup to see how many users went to next stage of explore courses in the funnel in both the control and treatment group. The metric Click through rate(CTR) for the “Explore Courses” button on the Homepage was then chosen to measure the level of engagement from the users in each group.
The null hypothesis here is the new CTR is less than or equal to the old CTR.
H0: CTR_new — CTR_old <= 0
The alternate hypothesis is what we are trying to prove, the new CTR is greater than the old CTR.
H1: CTR_new — CTR_old > 0
The data was collected for a period of almost 4 months with a control group size of 3332, and a treatment group size of 2996. The homepage actions, the visitors who _viewed or clicked _the button, were recorded.
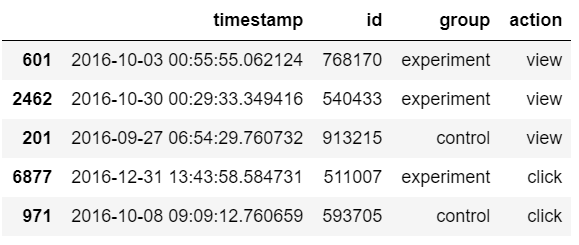
With this data we calculated the CTR for the control group and the treatment group.
#data-science #statistical-analysis #a-b-testing #marketing #data-analysis #data analysis