Some time ago I wrote a guide on setting up Kubernetes cluster on RaspberryPi:
After deployment, one of the first things people would like to see and monitor is cluster utilization. In this article I will explain how to install and use Metrics Server to get some quick stats with kubectl top command.
Metrics Server collect CPU and memory utilization information from all nodes and the pods in the cluster and can be easily accessed by using kubectl top command.
First we will need to fetch MetricsServer yaml file by running:
wget https://github.com/kubernetes-sigs/metrics-server/releases/download/v0.3.6/components.yaml
Now we will need to modify the file for our Pi arm64 architecture, so let’s open the file:
nano components.yaml
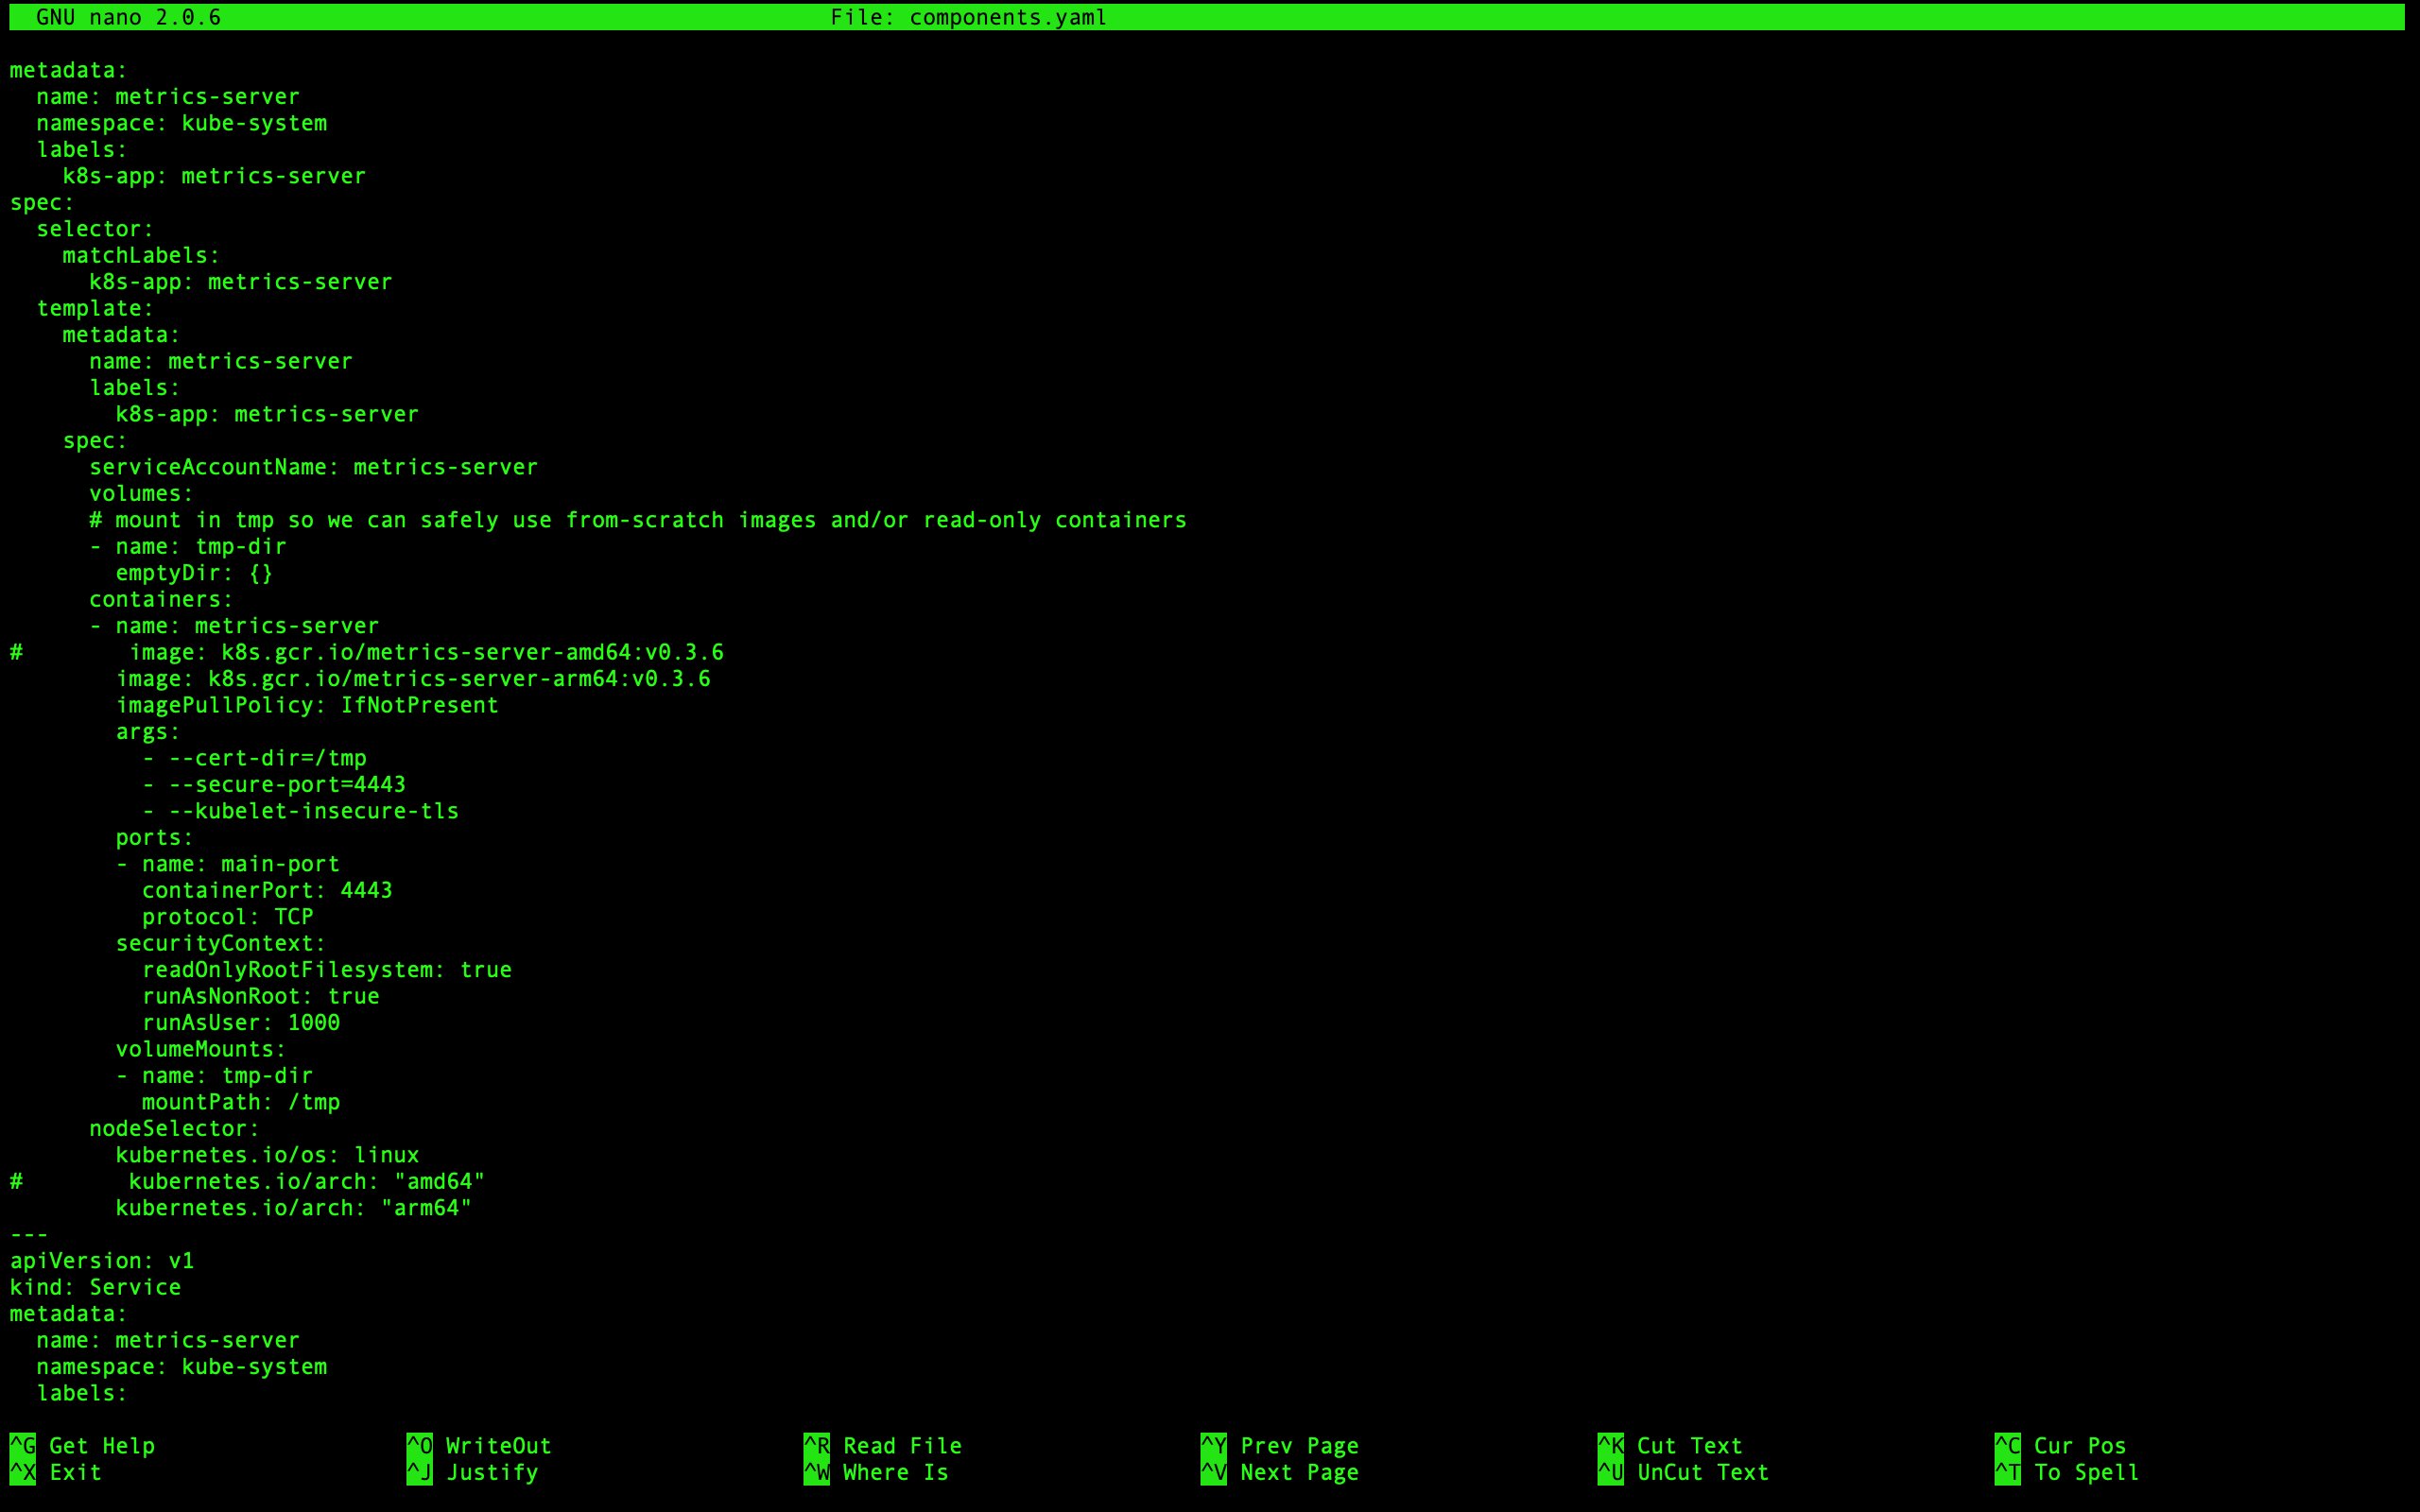
Changes to components.yaml
You will need to find and change following lines:
From:
image: k8s.gcr.io/metrics-server-amd64:v0.3.6
To:
image: k8s.gcr.io/metrics-server-arm64:v0.3.6
And from:
kubernetes.io/arch: "amd64"
To:
kubernetes.io/arch: "arm64"
We need to enable Metrics Server to work with self-signed certificate by adding:
- --kubelet-insecure-tls
to the following section:
containers:
- name: metrics-server
image: k8s.gcr.io/metrics-server-arm64:v0.3.6
imagePullPolicy: IfNotPresent
args:
- --cert-dir=/tmp
- --secure-port=4443
- --kubelet-insecure-tls
#kubernetes #metrics-server