Since the release of drill down support in version 0.19.23, you can build interfaces to let users dive deeper into visualizations and data tables. The common use case for this feature is to let users click on a spike on the chart to find out what caused it, or to inspect a particular step of the funnel — who has converted and who has not.
In this blog post, I’ll show you how to define drill downs in the data schema and build an interface to let users explore the underlying chart’s data. If you’re just starting with Cube.js, I highly recommend beginning with this Cube.js 101 tutorial and then coming back here. Also, if you have any questions, don’t hesitate to ask them in our Slack community.
You can check the online demo of the example here, and the source code is available on GitHub.
Let’s start hacking!
Defining a Drill Down in the Data Schema
Let’s start by setting up a new project with Cube.js and configuring drill down support in the data schema. We’ll use PostgresQL and our example e-commerce dataset for this tutorial. You can download and import it by running the following commands.
Shell
$ curl http://cube.dev/downloads/ecom-dump.sql > ecom-dump.sql
$ createdb ecom
$ psql --dbname ecom -f ecom-dump.sql
```

Next, install the Cube.js CLI if you don't have it already, and create a new project.

Shell

```
$ npm -g install cubejs-cli
$ cubejs create drill-downs -d postgres
Make sure you have the following credentials in the .env file.

Shell
CUBEJS_API_SECRET=SECRET
CUBEJS_DB_TYPE=postgres
CUBEJS_DB_NAME=ecom
Now, we're ready to launch the Cube.js server and navigate to the playground running at [http://localhost:4000](http://localhost:4000/).

Shell
$ npm run dev
Once you're in the playground, navigate to the Schema tab. Then, select the **orders** and **users** tables and click Generate Schema, as in the screenshot below.
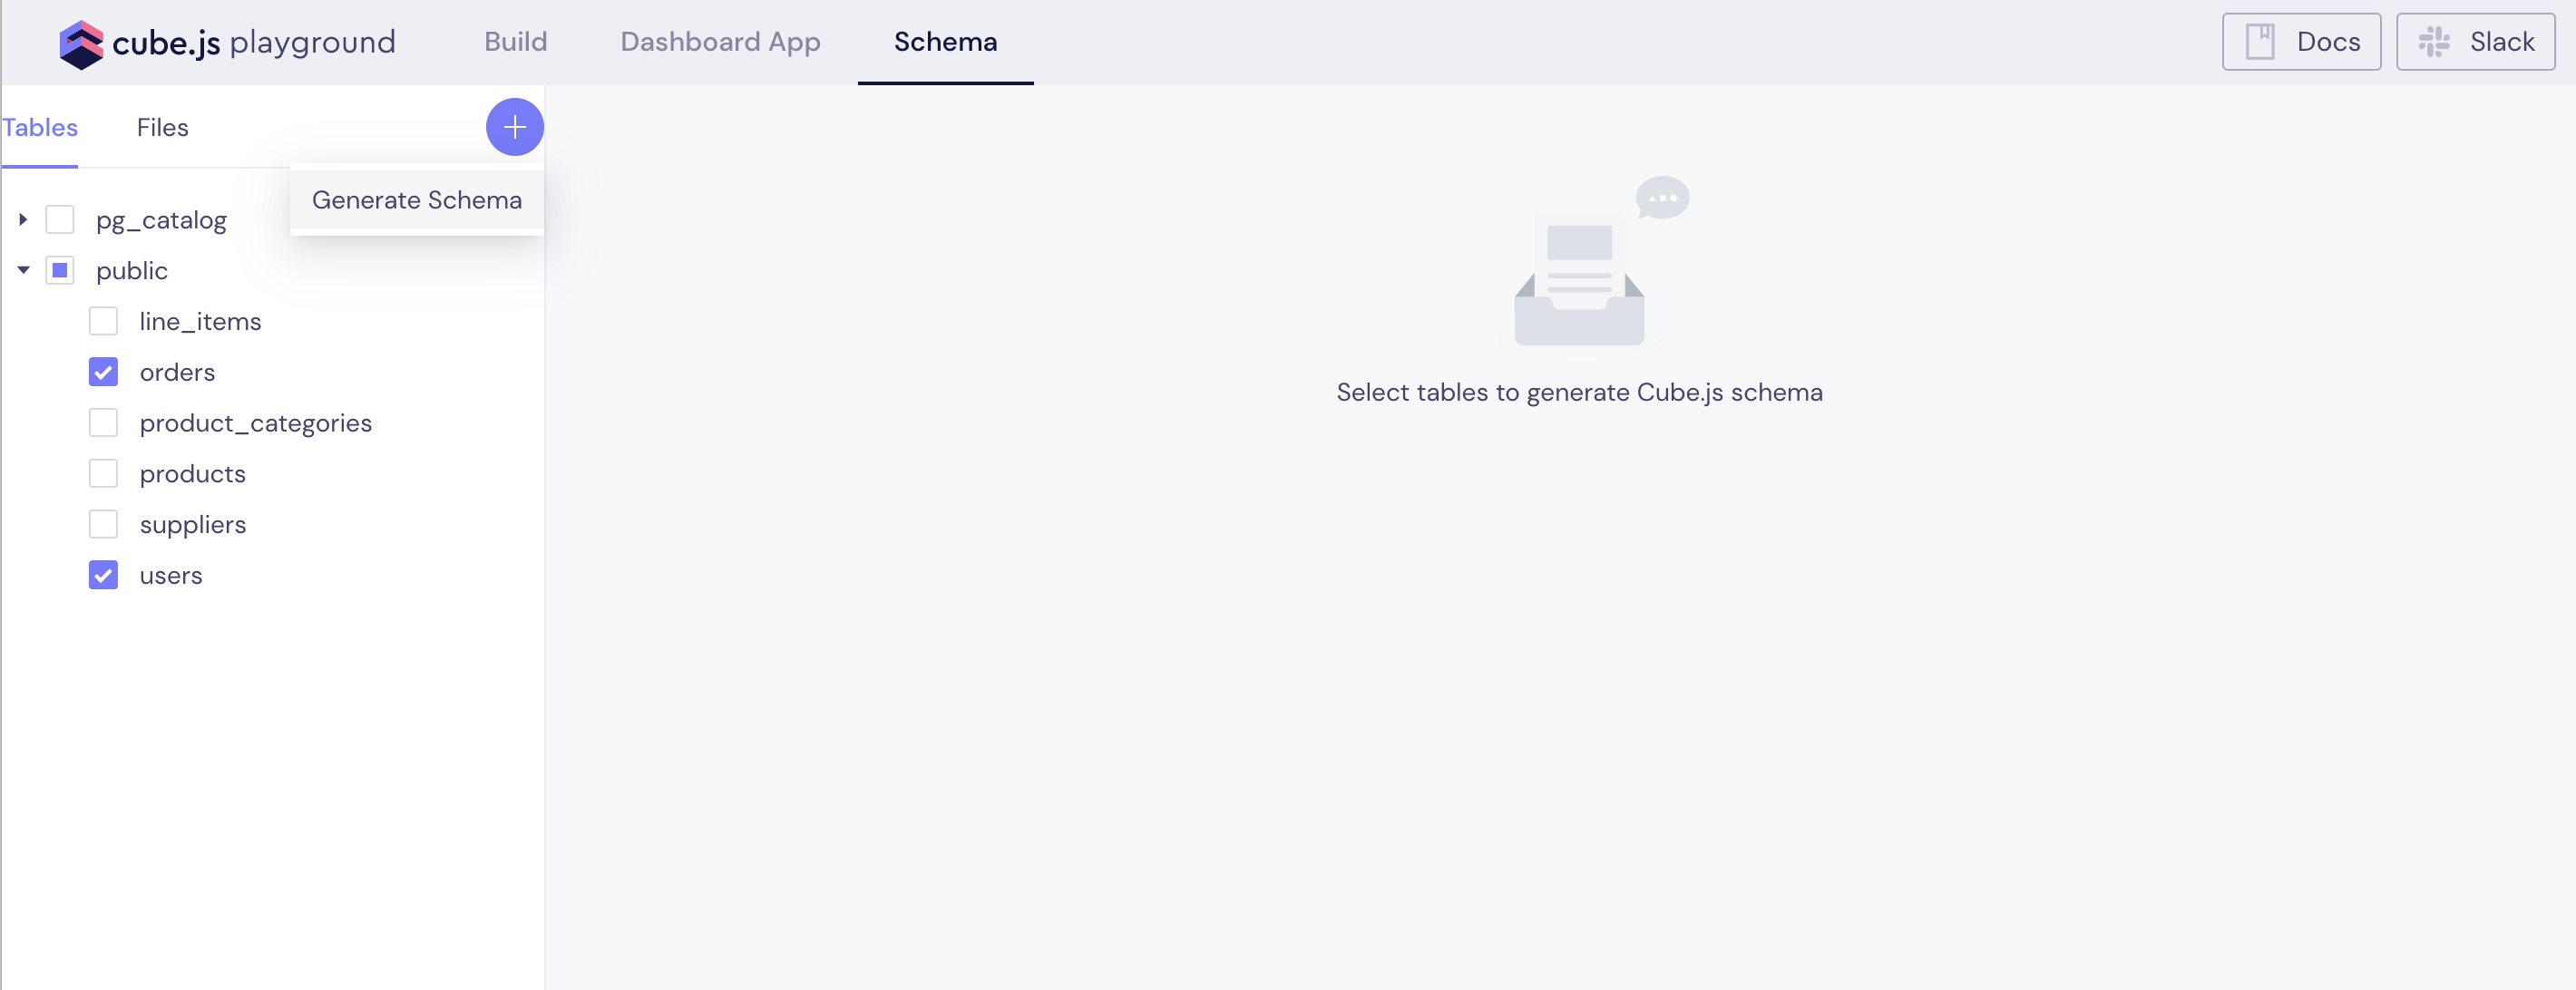
This will generate a basic data schema for users and orders tables, which already includes the `drillMembers` property on the `count` measure. The `drillMembers` property contains a list of dimensions that will be used to show the underlying data when drilling into that measure.
Let's take a closer look at the `Orders` cube and its `count` measure.
JavaScript
measures: {
count: {
type: count,
drillMembers: [id, createdAt]
}
}
```

It already has the basic dimensions listed in the `drillMembers` property: `id` and `createdAt`. We can add additional dimensions to that list. We also can reference dimensions from joined cubes—in our case, from Users.

Let's add more dimensions to the `drillMembers` property.

JavaScript

```
measures: {
count: {
type: `count`,
drillMembers: [id, status, Users.firstName, Users.city]
}
}
That's all we need in the data schema to build our drill down. On the frontend, we're going to make a bar chart to display orders over time. When a user clicks on the bar, our app will display the table inside the modal window, with details about the orders in that bar.

## Building the Drill Down UI

We'll use Cube.js templates to generate a frontend app. Navigate to the Dashboard App tab and select the Material-UI React Dashboard. It will take several minutes to set up the Dashboard App and install all the dependencies inside the `dashboard-app` folder in your project.

Please note: although we use React in this example, you can build the same drill down in [Vue.js](https://cube.dev/docs/@cubejs-client-vue), [Angular](https://cube.dev/docs/@cubejs-client-ngx), or [Vanilla JS](https://cube.dev/docs/@cubejs-client-core).

The first step is to render a bar chart. We're going to plot the count of orders over time, grouped by the status. Eventually, we want to let users click on a specific group and day to explore the underlying orders— e.g., orders created on June 20 and already shipped.

Let's create a `dashboard-app/src/DrillDownExample.js` file with the following content.
#javascript #tutorial #api #data visualization #react #cubs.js