A wise man once said that the 2020–30 decade will be the decade of graph data science. Actually, that happened just a few days ago at the Nodes 2020 conference, and that wise man was Emil Eifrem presenting at the keynote of the Nodes 2020. In case you missed the conference, all the presentations are already available online.
Only fitting Emil’s statement, a pre-release of the 1.4 version of the Neo4j Graph Data Science library was published a couple of days ago. It is a significant milestone for the GDS library. A lot of new features were added in this release. If you are interested to learn more, you can inspect the release statement. In this blog post, we will take a look at the new k-Nearest Neighbours algorithm. But before we do that, we will do a proper graph exploratory analysis.
I’ve written so many blog posts it takes an effort to find some excellent datasets I haven’t explored yet. This time I saw a cool repository on Kaggle containing data about the Marvel Universe. Unfortunately, I later realized that only comics and characters files have matching ids. As a graph analyst, we want to connect all the relevant data, and without matching ids, that’s a bit hard. I then realized that those matching ids were scraped from the Marvel API. I fetched some additional data from the API to enrich our graph. The information about the characters is not available over the API but is available on their website. This made me put on my Spider-Man suit and test my web crawling abilities. I’m quite proud to say that I learned to use Selenium and efficiently scraped the information about the characters from the Marvel website.
Graph import
You can easily import this Marvel Universe graph by running the cypher statements from this gist. It contains ten simple LOAD CSV cypher statements and an apoc.schema.assert procedure to define unique constraints and indexes. If you use Neo4j Browser, make sure you have enabled the multi-statement query editor.

This way, you can copy the content of the whole gist and not worry about executing each statement separately.
Graph schema
Now that we have imported the graph, we can examine its schema with the following procedure:
CALL db.schema.visualization()
If you run this procedure in Neo4j Browser, you will get this nice visualization of the graph schema.
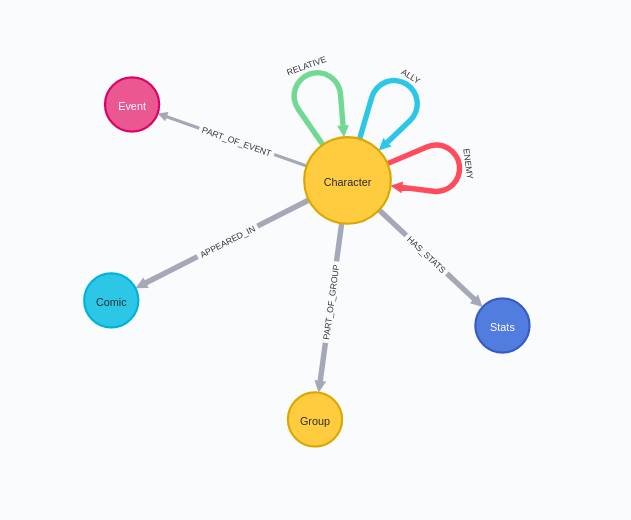
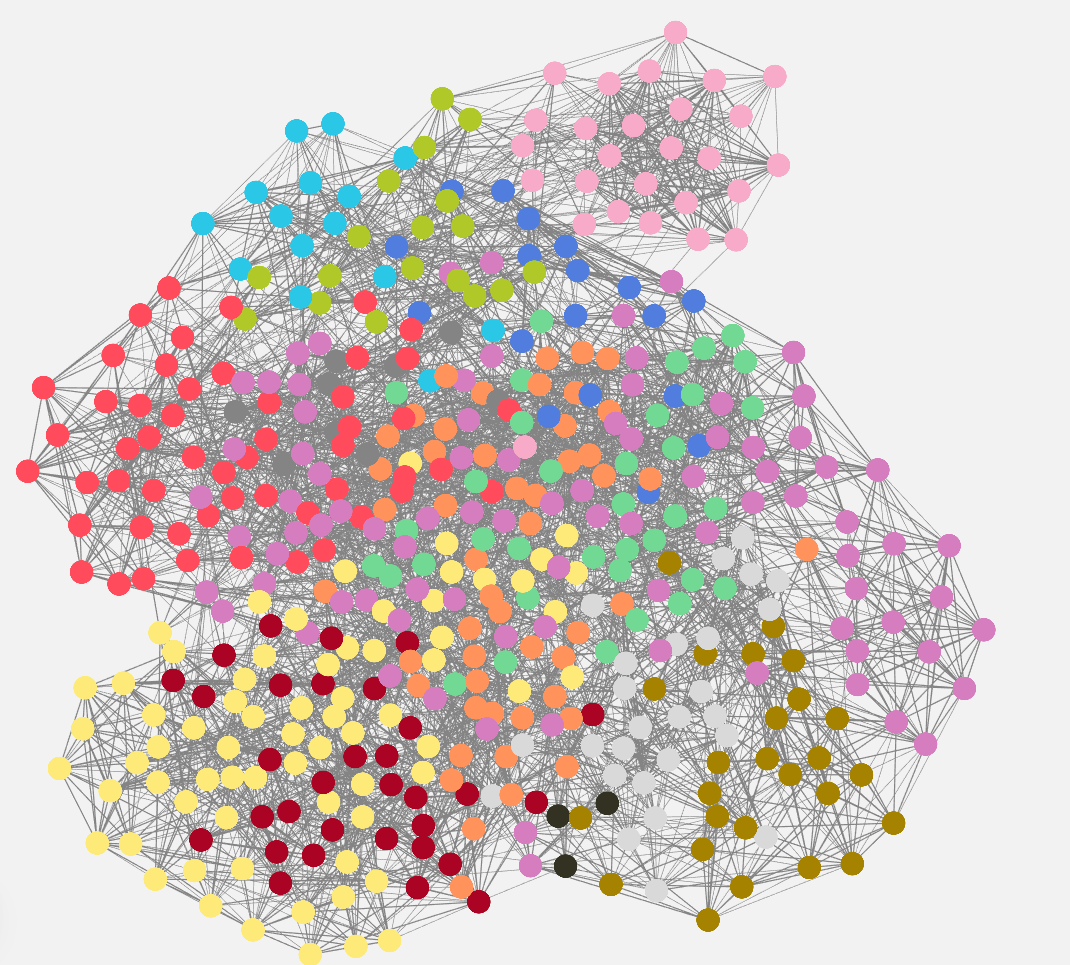
In the center of the graph, there are characters, also known as heroes. They can appear in multiple comics, are part of an event, and can belong to a group. For some of the characters, we also know their stats like speed and fighting skills. Finally, we have social ties between characters that represent relative, ally, or enemy relationships.
To get a feel for the size of the graph, we can run the following APOC procedure:
CALL apoc.meta.stats() YIELD labels
return labels
#marvel #data-science #algorithms