Image compression is a type of data compression applied to digital images without degrading the quality of the image to an unacceptable level. The reduction in file size allows more images to be stored in a given amount of disk or memory space. It also reduces the time required for images to be sent over the Internet or downloaded from web pages.
How does image compression work? [1]
Image compression algorithms take advantage of visual perception and the statistical properties of image data to provide superior results. There are two kinds of image compression methods — lossless vs lossy. Let’s take a quick look at them both.
Lossless compression:
This is a method used to reduce the size of a file while maintaining the same quality as before it was compressed. Lossless compression does not compromise the data’s quality and the file can be restored it its original form. The size of the file does not change in this type of compression. Algorithms used for lossless compression are:
- Run Length encoding
- Huffman Coding
- Arithmetic Coding
Lossy compression:
Lossy compression is the method of compression that eliminates the data which is not noticeable. To give the photo an even smaller size, lossy compression discards some parts of a photo which are less important. The compressed file cannot be restored in its exact original form. In this type of compression data quality is compromised and the size of data changes. Lossy compression is used mainly for images, audio and, video compression and different lossy compression algorithms are:
- Discrete Cosine Transform
- Fractal compression
- Transform Coding
We will be using the K-Means Clustering technique for image compression which is a type of **Transform method of compression. **Using K-means clustering, we will perform quantization of colors present in the image which will further help in compressing the image.
What is K-Means Clustering?
K-Means algorithm is a centroid based clustering technique. This technique cluster the dataset into k different clusters. Each cluster in the k-means clustering algorithm is represented by its centroid point.
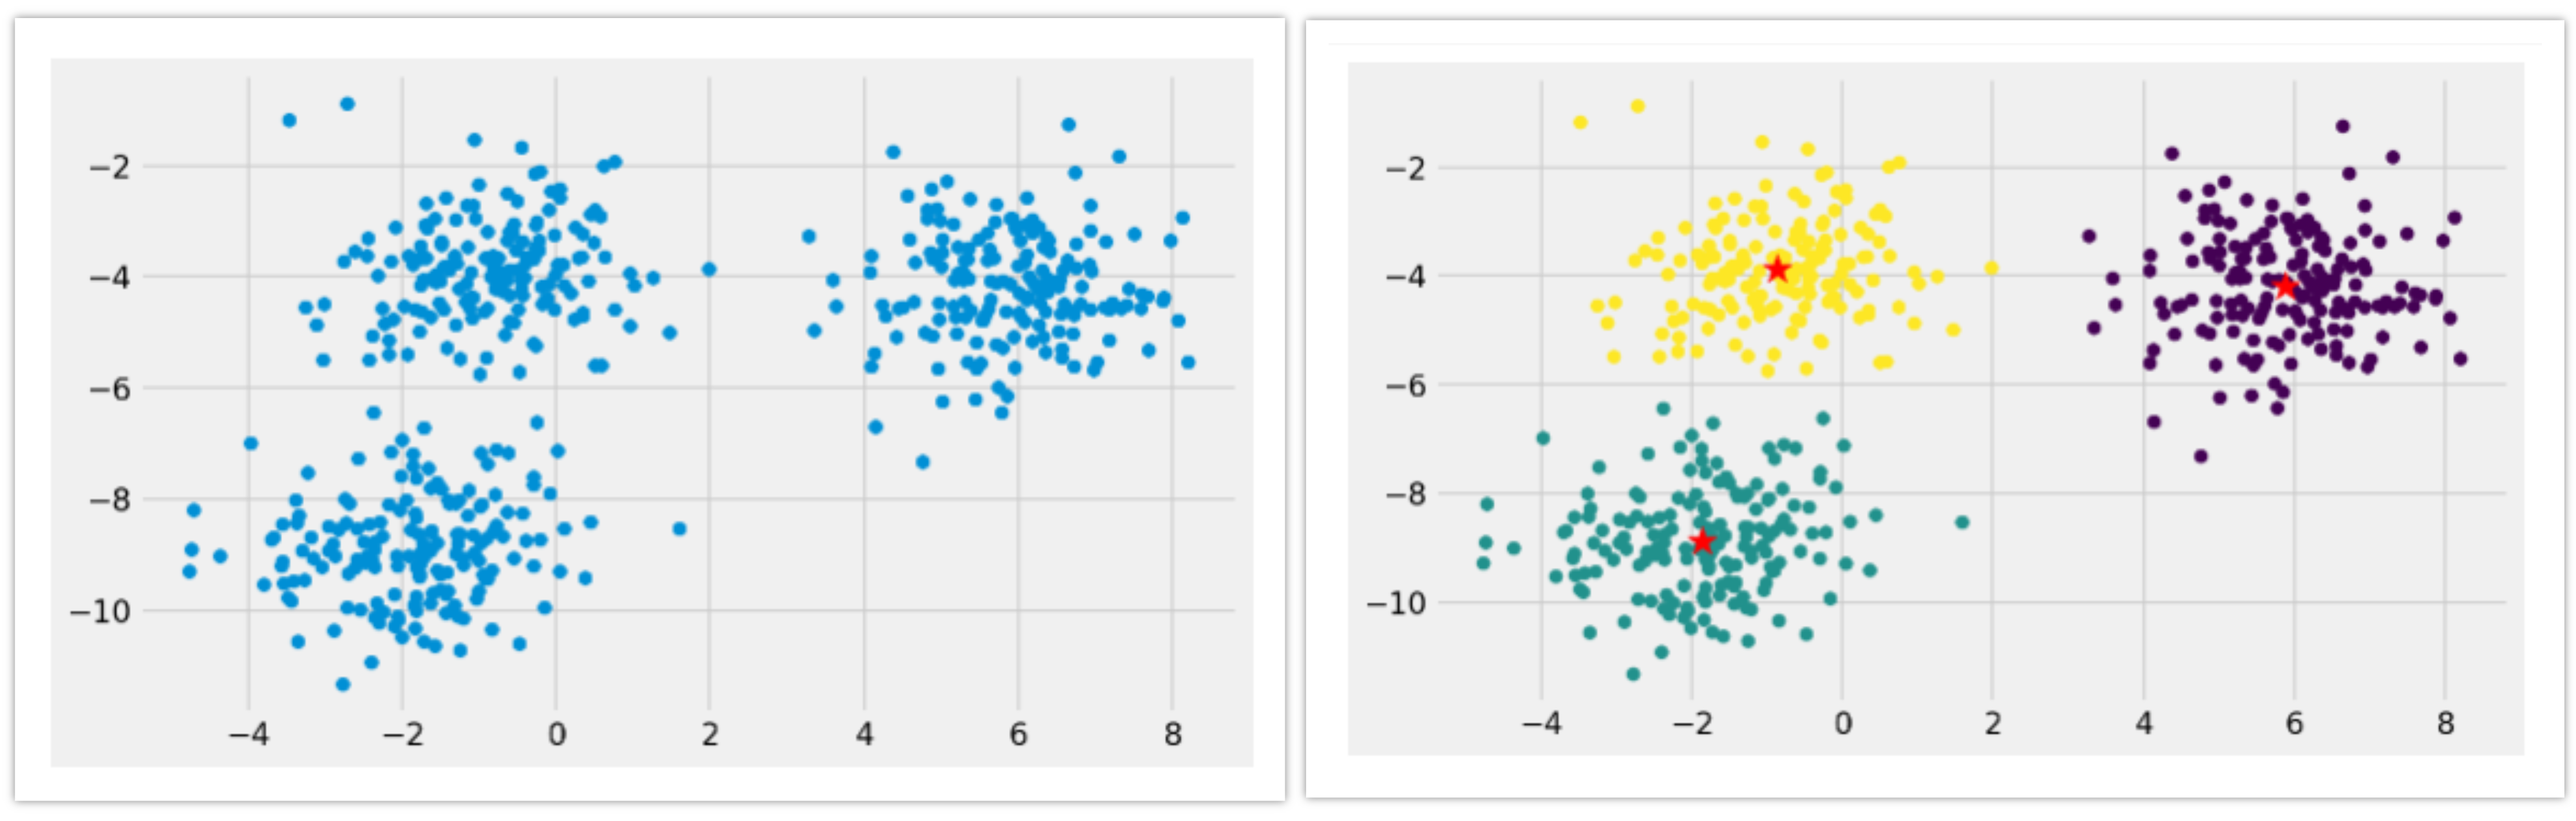
Left Image: Plot of the dataset, Right Image: Plot of the result of 3-means clustering, (Image 1)
The above image (image 1) describes how 3 clusters are formed for a given dataset using the k-Means clustering algorithm with the value of k=3.
Further, read this article to know more about the k-Means Clustering algorithm.
#clustering #artificial-intelligence #image-processing #data-science #data analysis
