I knew I wanted to do two things in the process of writing my bachelor’s thesis: improve my programming skills and work with time-series data prediction.
What I didn’t know, however, is what I wanted to study. However, it had to be something I truly liked and not necessarily connected to my major.
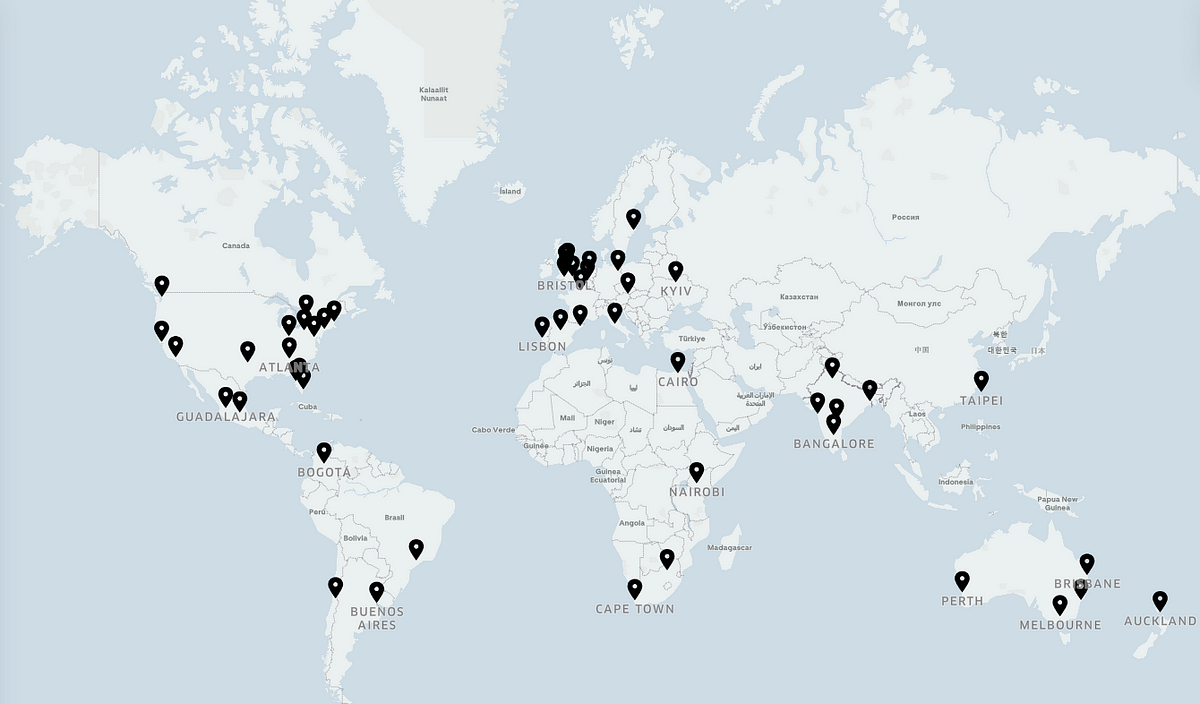
Since I like maps and… things that move, I decided to somehow use data from a website I had recently come across and fallen in love with (probably after playing many hours of SimCity as a teenager) — the Uber Movement website.
It allows you to visualize anonymized data for average travel times from a certain point (or zone) to any other point in that same city.
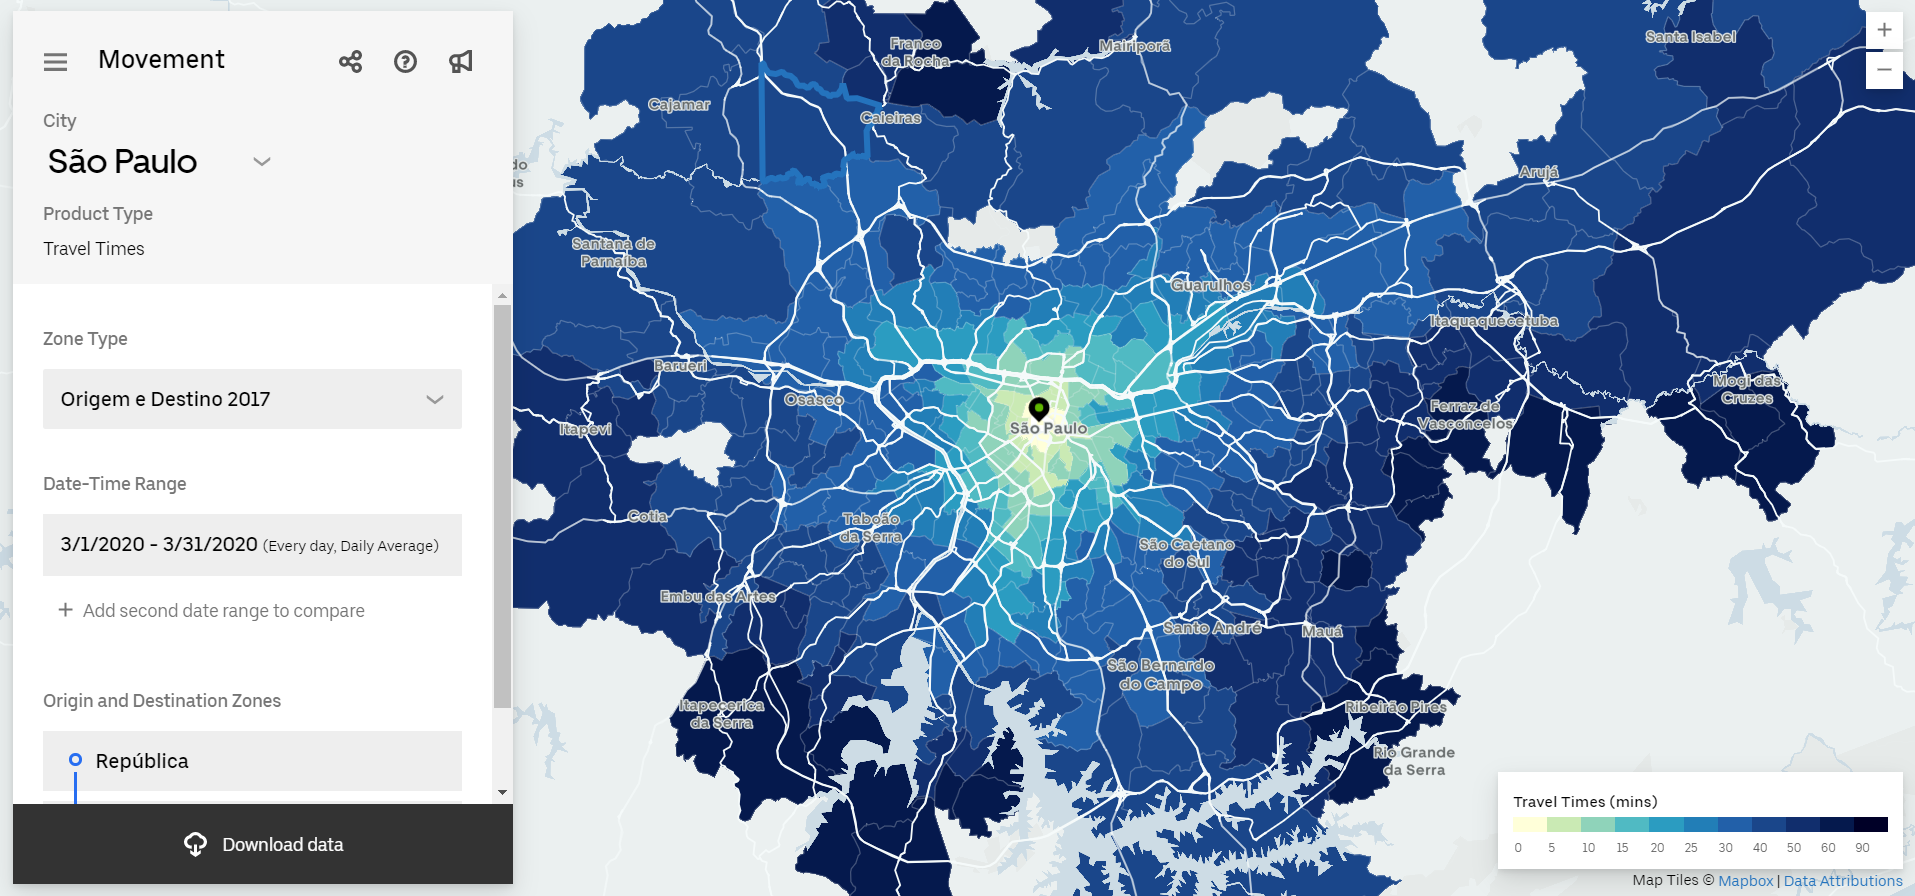
Sample travel times for my home town, São Paulo.
“Great!”, I thought. “Let me just download the travel times and plot some numbers so I can move on to exploratory data analysis (EDA).”
As it turns out, the data I wanted was not so easy to extract.
The Problem
In order to have a more statistically precise outcome, I needed all the data I could get. The more rows of data I had, the greater the predictive power of my models (potentially). The smaller the time increment, the better. Therefore, I needed to get my hands on daily travel times.
The Uber Movement website allows you to download data from any zone to every other zone in the city. However, there’s a catch. Whatever date range you are interested in getting travel times for does not consist of daily data.
That is, if you select to download values from January 2020 to March 2020, you won’t receive 90 values, which is roughly the amount of days in that range. Rather, it spits out a csv file with one single value for the three-month average travel time for each pair of zones.
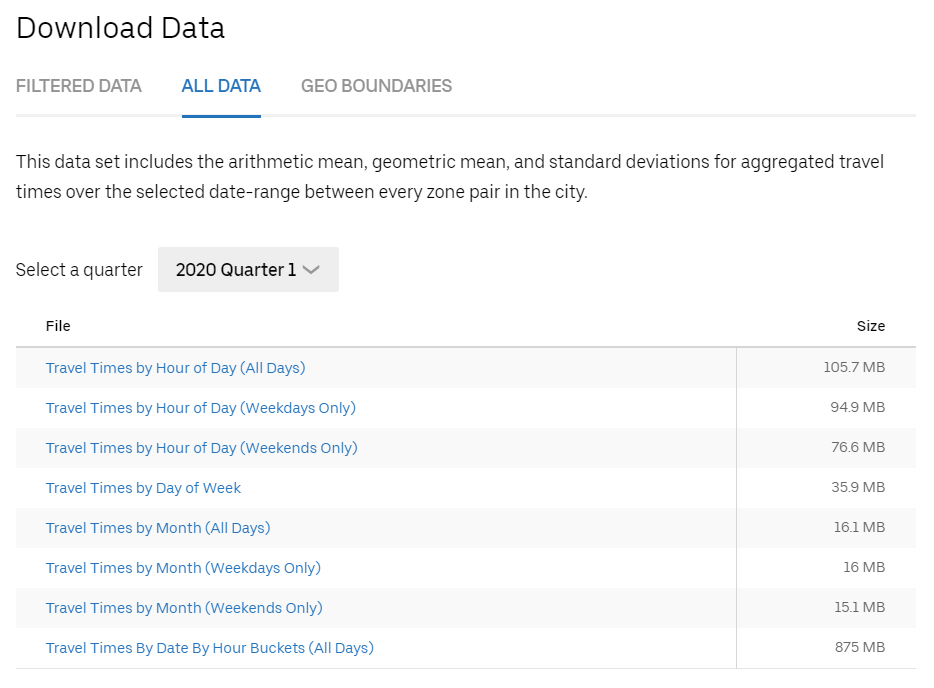
Different formats of travel times data you can download for every given pair of zones.
This meant that I had to compromise on the amount of data points throughout time, to get lots of values for a single point in time.
#programming #automation #data-analysis #time-series-analysis #uber #data science