For most SEO specialists it is mandatory to keep track on search visibility and keyword rankings in search engines. There are a lot of tools who provides this, such as AWR Cloud, STAT, Ahrefs, SEMrush and many more. This data can be overwhelming when you have a lot of keywords to track and want to be able to compare current rankings with rankings in the past for you and your main competitors.
Also, this amount of information (together with server speed) can impact the fun of analyzing when the information you want is not instantly loaded.
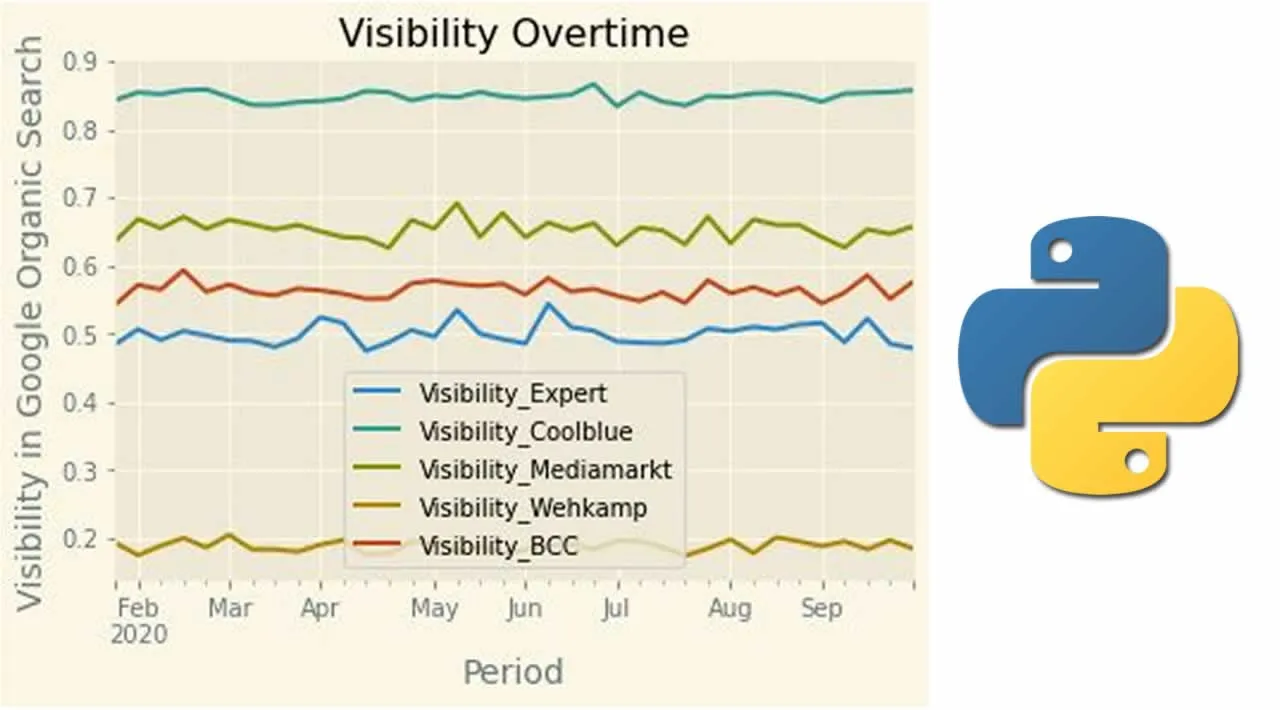
Python can be a good way to analyze a lot of data, make some custom calculations on this and plot it just the way you want!
In this article I will write a step-by-step process for creating your own dashboard using Python’s Pandas and (in my case) SEMrush exports. As said, there are a lot of keyword tracking tools, so any other export is fine as well but needs some customization tweaks.
Global idea and working of the dashboard
The dashboard is set up in 4 main steps:
- Collect and clean the exports from SEMrush (or any other ranking export file) and create a useful work file to continue
- Add a visibility calculation to the data and plot this over categories
- Plot rankings overtime per category and keyword
- Create a pivot dashboard for specific insights
The result will be good understanding of ranking and visibility fluctuations, find issues per category and even per keyword group. This can give you a very specific idea where to optimize.
Let’s get started
For my company we track 571 keywords at SEMrush over 88 categories (tags). For this article I have collected exports from SEMrush on a weekly base for mobile rankings. I also track the rankings of the 4 main industry competitors.
#jupyter-notebook #python #dashboard #seo