The D3.js visualization library can be used for creating beautiful graphs and visualizations using data from external sources including CSV files and JSON data.
To give you an example, this D3.js animation inside the Google Sheets associated with the COVID-19 tracker project visualizes the growth of Coronavirus cases in India over time. It uses the Google Visualization API, D3.js and the very-awesome Bar Chart Race component built by Mike Bostock, the creator of D3.js.
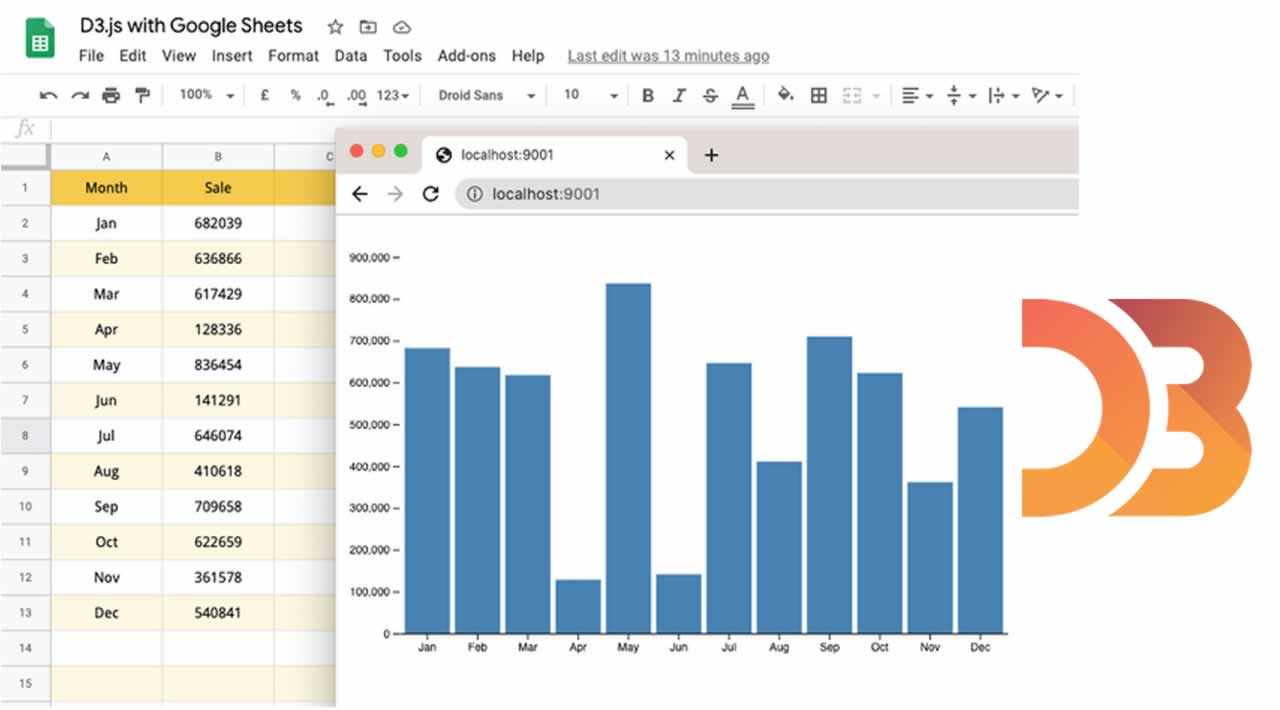
Google Sheets and D3.js
This guide explains how you can use data in your Google Spreadsheets to create charts with D3.js using the Visualization API. The data is fetched in real-time so if the data in your Google Sheets is updated, it is reflected in the graph as well.
#google sheets #google apps script #d3.js #javascript