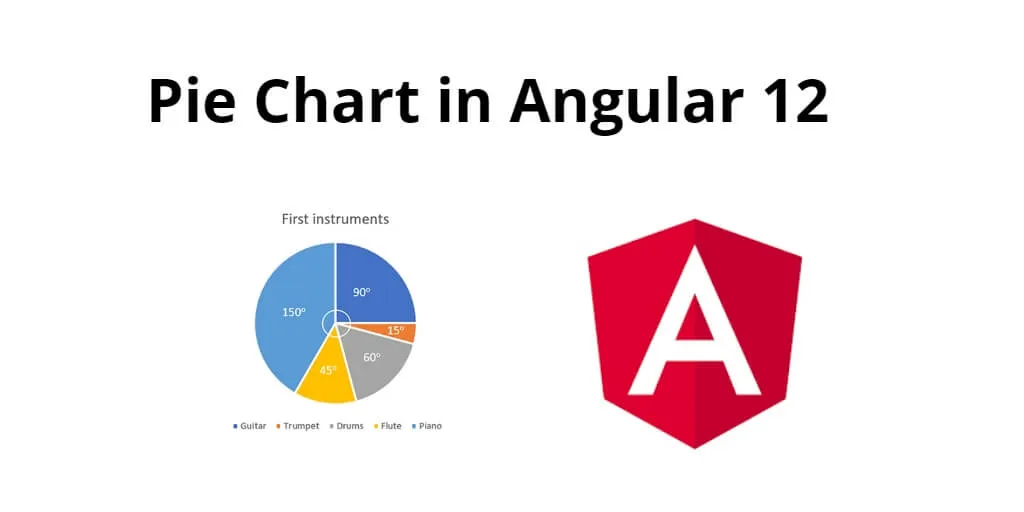
Pie chart in angular 12 using ng2-charts example; In this tutorial, i am going to show you how to install ng2-charts and create pie char in angular 12 app.
Pie charts can be used to show percentages of a whole, and represents percentages at a set point in time. Unlike bar graphs and line graphs, pie charts do not show changes over time. The following pages describe the different parts of a pie chart.
Angular /12 Pie Chart Using Ng2-Chart JS
- Step 1 – Create New Angular App
- Step 2 – Install Ng2-Charts JS Library
- Step 3 – Import Modules on App.Module.ts File
- Step 4 – Add Code on View File
- Step 5 – Add Code On pie-chart.Component ts File
- Step 6 – Start the Angular Pie Chart App
https://laratutorials.com/angular-12-pie-chart-with-ng2-charts/

14.75 GEEK