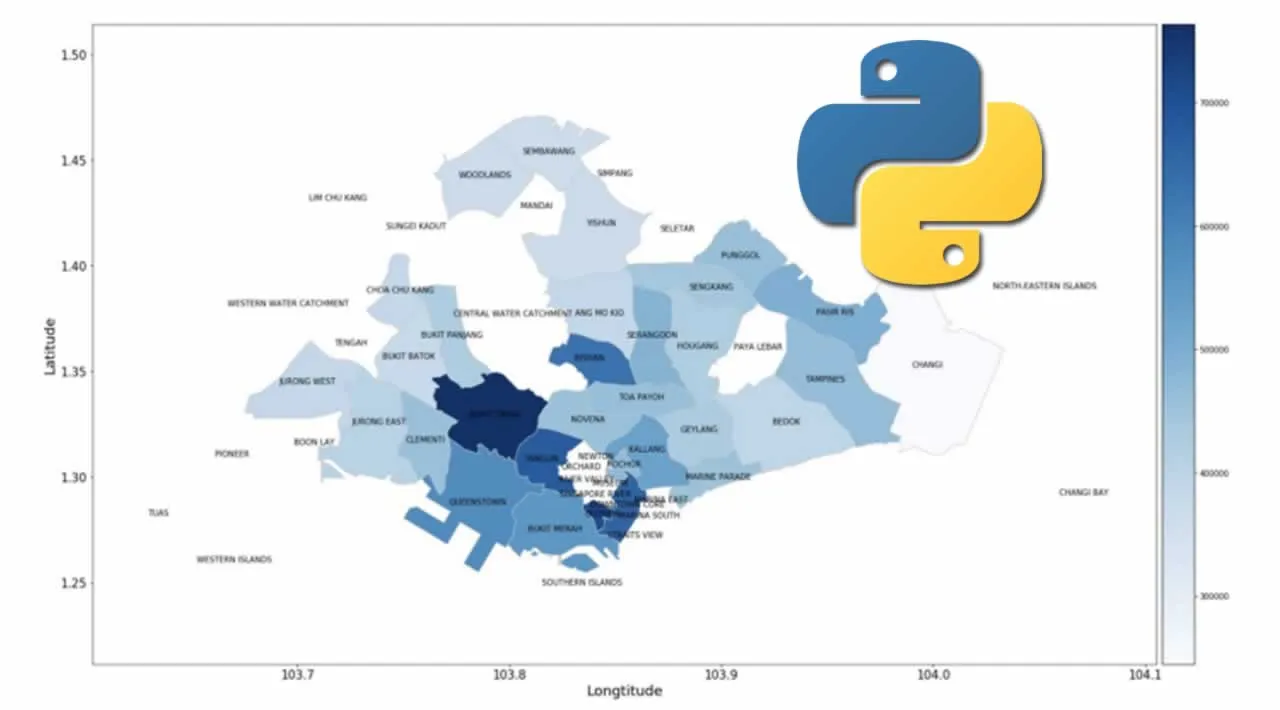
In this article, I will share how we can create choropleth maps with Python and Google Geocoding API, using data from Singapore’s resale housing price.
Creating a choropleth map can be challenging at times, simply because:
- Most data sets used in examples online are preprocessed with the city/state/coordinates already given. In reality, most datasets contain only the location addresses, without any city labelled. Hence, we need to find its location coordinates first and decide how to categorise it in the different cities.
- Shape files showing the different city/state boundaries are not easily available. The most common shape files available are the world map (demarcating the different countries), or the map of USA (demarcating the different states). Hence, we need to find a shape file of Singapore to conduct a thorough analysis.
This article seeks to address the above mentioned challenges and successfully plot out a choropleth map of Singapore’s resale housing prices.
Data Sets
- HDB Resale Flat Prices from Jan 2017
- Shape File: Singapore Master Plan 2014 Planning Area Boundary-(No Sea)
Overview
- Data Preprocessing
- Get Location Coordinates from Address
- Split the map into towns/city/areas of interest
- Convert DataFrame to GeoDataFrame
- Plotting the choropleth map.
#data-science #choropleth-map #geopandas #python
7.75 GEEK