One of the concepts that took me longer to understand in Data Science was the Receiver Operating Characteristic (ROC) curve. This is a visual representation of how well your classification model works.
In this blog, I want to explain how the ROC curve is constructed from scratch in three visual steps.
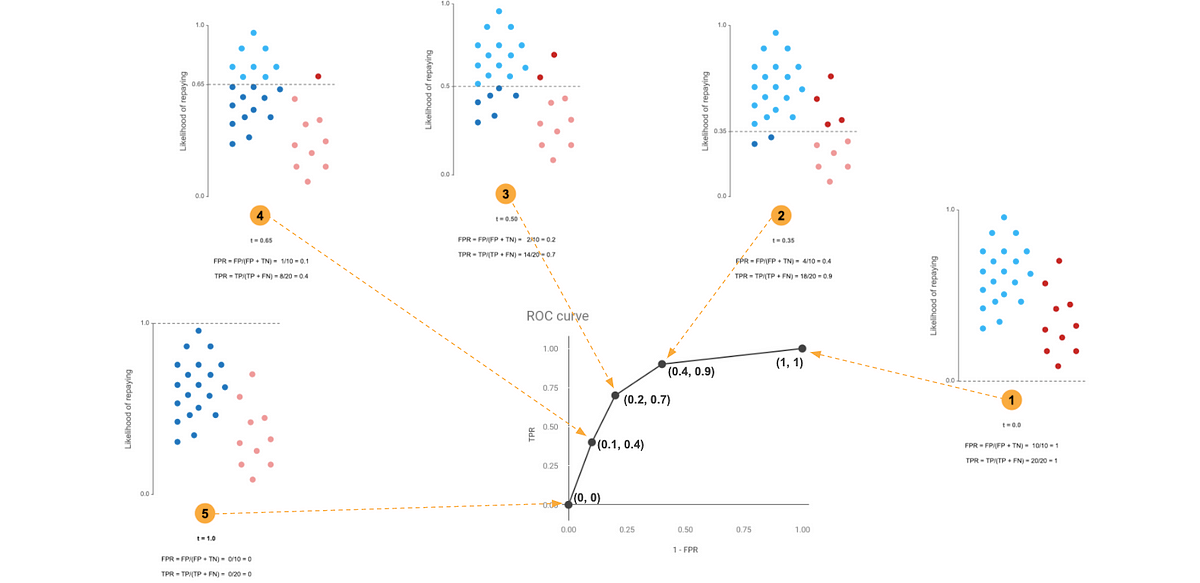
Step 1: Getting classification model predictions
When we train a classification model, we get the probability of getting a result. In this case, our example will be the likelihood of repaying a loan.
#data-science #machine-learning #classification #classification-algorithms
1.25 GEEK