Uber is a cab service provider for people wanting to travel from one place to another. Here, I have taken an Uber request dataset from Kaggle to try and perform analysis using the visualization libraries such as seaborn and matplotlib. At the end of this article, I have given a link to my Kaggle notebook where I have performed a detailed analysis of this Uber dataset.
The steps taken to perform this analysis are:
- Understanding the dataset
- Cleaning the data
- Draw meaningful conclusions using the visualization libraries.
Let us jump right into the analysis and see what can be understood to make relevant conclusions.
1.Understanding the dataset
Before moving on to understanding the fields/observations in the data, let us import the required python libraries required for this analysis.
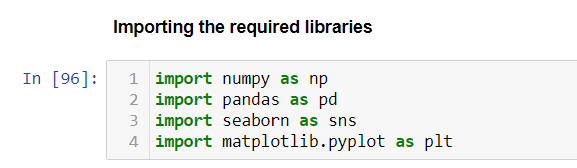
Importing the required Python libraries
We will import the dataset and store it as a data frame for our future analysis. To see what features the data contains, we use the **head () **function which by default prints the first 5 rows of the dataset.
#data-science #eda #dataset #uber #data-analysis